Analysis of Fluorescence Polarization competition assays with AFFINImeter

Fluorescence Polarization competition assays are widely used in numerous research fields to determine the affinity of unlabeled ligands that compete with a fluorescent probe for binding with the same macromolecule. Herein, we show how to perform a thoughtful analysis of these experiments with AFFINImeter for spectroscopic techniques, to elucidate, not just IC50 values, but also a quantitative direct measurement (KA) of the binding affinity.


Introduction


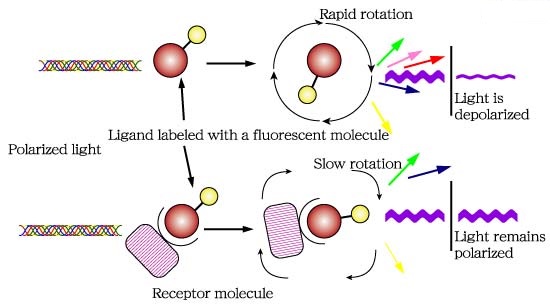
Fluorescence polarization (FP) is a powerful technique that nowadays is widely utilized in high-throughput screening (HTS) and drug discovery (1). In FP assays monitoring a binding event is possible mainly because this technique is sensitive to changes in molecular weight. The assay requires of a fluorescent molecule (the probe) that is excited by plane-polarized light. For small molecules, the initial polarization decreases rapidly due to rotational diffusion during the lifetime of the fluorescence, which results in low fluorescence polarization. When the small fluorescent molecule binds to a larger molecule (and consequently of slower rotation) an increased fluorescent polarization is observed (Fig. 1).
Advances in experimental aspects of the technique like assay design and fluorescent probes is enabling the application of FP to increasingly complex biological processes (1).

Fig.1. The principle of fluorescence polarization (2).


Frequently, a competition displacement assay format is used in FP experiments where a fluorescent labelled molecule bound to a macromolecule is displaced by an unlabeled molecule with the consequent decrease of polarization. This assay yields a quantitative measure of IC50 values (half maximal inhibitory concentration) of the unlabeled competitors. However, IC50 does not provide a direct measure of affinity and the calculation of the binding constant (KA) is often desirable. In this sense, the software AFFINImeter Spectroscopy offers exclusive analysis tools to perform a thoughtful analysis of FP competition assays, to directly deliver values of binding constants of the interaction between the competitor and the macromolecule. As an illustrative example, we present herein the use of AFFINImeter Spectroscopy for the analysis of FP competition assays to characterize oligosaccharide –protein interactions.


FP competition assays to study the binding between midkine and chondroitin sulfate-like tetrasaccharides


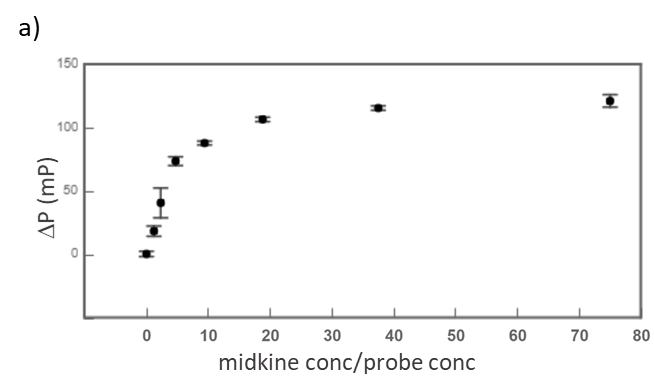
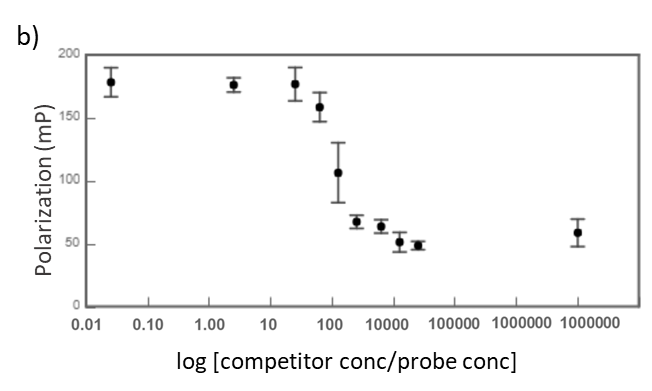
Midkine is a cytokine which biological activity is regulated by its binding with glycosaminoglycans (GAGs), such as heparin and chondroitin sulfate. To better understand these recognition processes Pedro M. Nieto et al. have recently reported the binding of a series of synthetic chondroitin sulfate-like tetrasaccharides with midkine, using FP competition assays (3). First, the direct binding of midkine and a fluorescein labelled heparin hexasaccharide (fluorescent probe) was monitored in a direct FP titration (Fig. 2a). Second, FP competition assays were performed, in which the polarization of samples containing fixed concentrations of midkine and fluorescent probe was recorded in the presence of increasing concentrations of different synthetic sugars to obtain the corresponding IC50 values (Fig. 2b) (3).


Fig.2. a) Binding curve of the titration of fluorescent probe with midkine 3a;b) Representative competition curve (semi-log plot) of an FP competition assay where the fluorescent probe is displaced from a pre-formed complex with midkine by the competitor.


Analysis of FP competition assays with AFFINImeter Spectroscopy


The determination of KA of the interaction of the unlabeled ligand with the macromolecule in an FP competition assay is possible if the corresponding curve is analyzed using a competitive binding model where two equilibria are described, one between the free species and the macromolecule–probe complex and one between the free species and the macromolecule–competitor complex. In this analysis, the KA value of the interaction between probe and macromolecule can be fixed (as it can be previously calculated from the direct binding experiment) in order to determine KA of the competitor-macromolecule complex. Yet, a more robust approach consists of a global analysis of direct and competitive curves where constraints between experimental parameters are imposed. Using this approach, we have used AFFINImeter Spectroscopy in the analysis of data from the direct measurement of the fluorescent labelled hexasaccharide binding to midkine and together with data from the displacement assay using an unlabeled, synthetic disaccharide as a competitor (4).

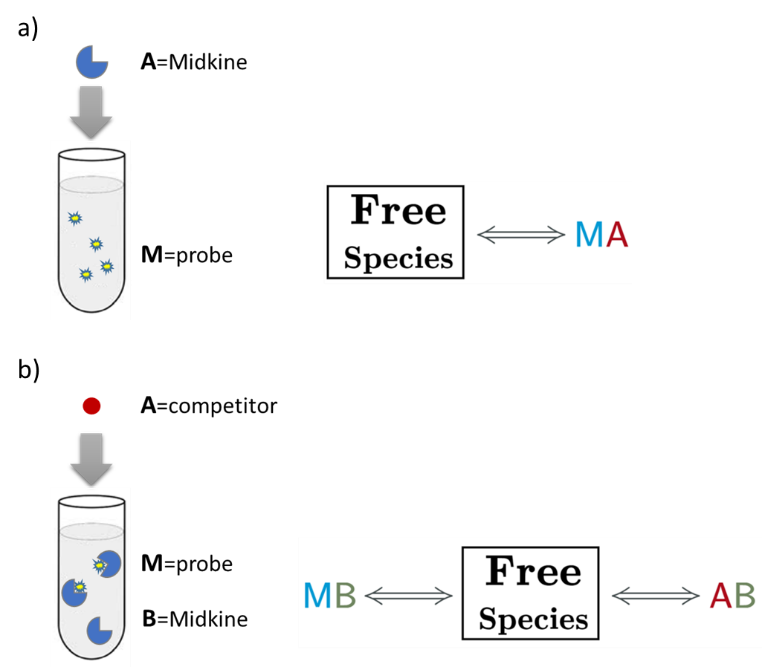
An AFFINImeter fitting project was generated where the curve from the direct titration and two curves from replicates of the competitive assay were included. A 1:1 simple binding model and a competitive model were used to fit direct and competitive data, respectively (Fig. 3).

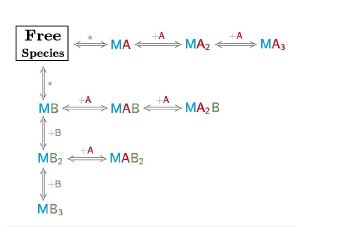
Fig.3. Schematic representation of the binding models used to fit the FP data.5 These models can be easily built with the “model builder” tool of AFFINImeter where a) in the 1:1 model “M” represents the species sensitive to binding (fluorescent probe) and “A” represents the titrant (midkine); b) in the competitive model “M” is the sensitive species (probe), A is the titrant (competitor) and B is a third species involved in the event (midkine in a preformed complex with the probe).


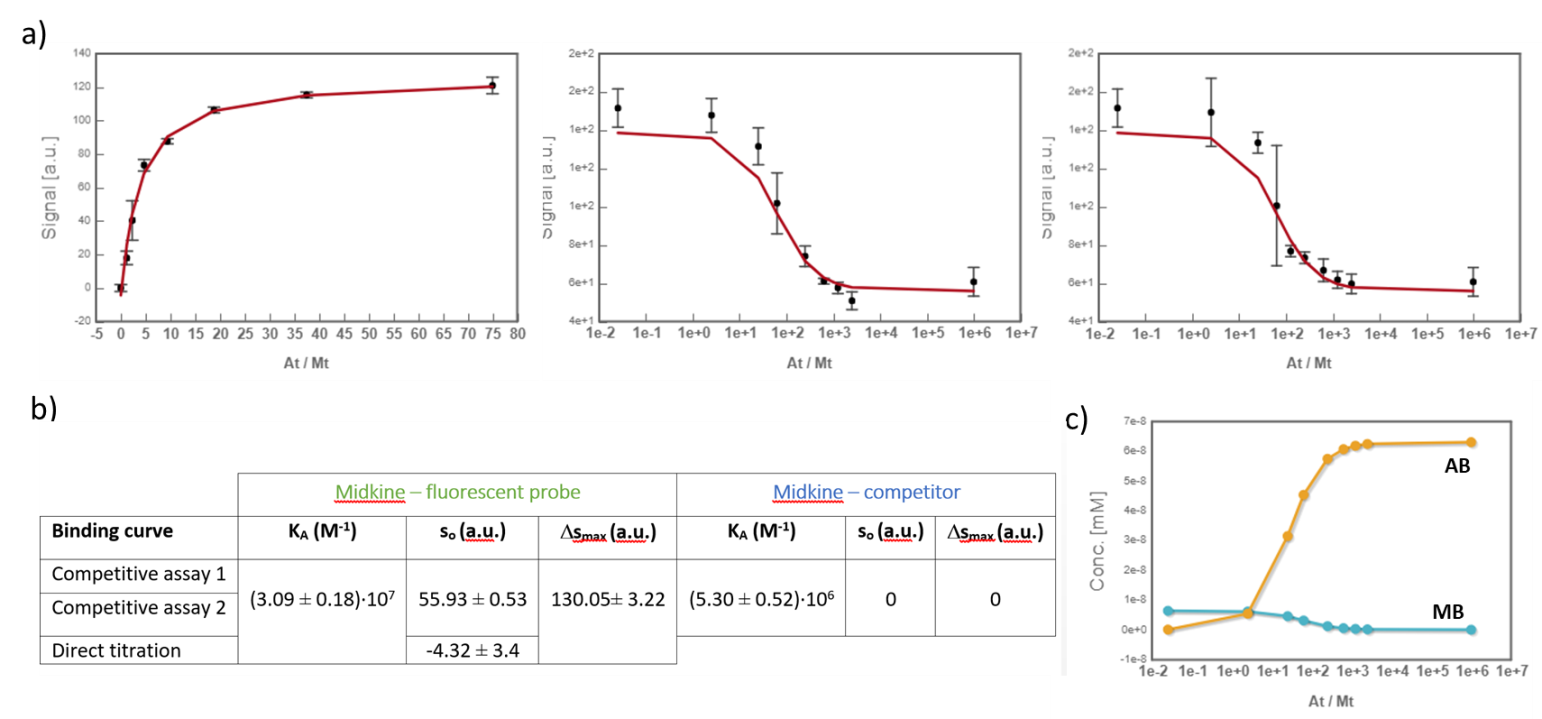
In the analysis, the fitting parameters considered were the KA of each complex, the signal value of the unbound state (s0), and the maximum signal change (Δsmax) of the midkine-probe complex formation. Δsmax of the midkine-competitor complex is equal to zero because the competitor is not fluorescent. Since midkine-probe binding is present in both models, restrictions were made considering that KA and Δsmax of the 1:1 model (FS↔MA) are equal to the same parameters describing this equilibrium in the competitive model (FS↔MB). Besides, s0 was common between replicates of the competitive assay. It is worth to mention that the curves analyzed are the mean of three replicate experiments and the corresponding standard deviation of the curve data points are also considered in the fitting process.  The global analysis performed in this way returned the KA of the interaction of midkine with the probe, (3.09 ± 0.18)*107 M-1, and with the competitor, (5.30 ± 0.52)*106 M-1 (Fig. 4). Additionally, AFFINImeter automatically generates the species distribution plot, valuable in the interpretation of results. The species distribution plot of Fig. 4c shows the displacement of the probe by the unlabeled disaccharide in the competition assay.


Fig.4. a) Global analysis of FP curves from the direct titration of probe (10 nM) with midkine (12 – 750 nM) and from a competitive assay consisting of a sample with probe (10 nM) and midkine (63 nM) where the competitor is added at increasing concentrations (0 – 20 mM). Curves from two replicates of the competitive assay were used in the analysis. All the polarization values are the average of three replicate wells and the error bars represent the corresponding standard deviation; b) values of KA, s0 and Δsmax determined for each equilibrium; c) species distribution semi-log plot of the competitive assay.


Conclusions


This case study exemplifies the utility of AFFINImeter Spectroscopy in the analysis of FP competitive binding assays. The advantages of using this software rely on the possibility to obtain reliable KA values of the binding between competitor and macromolecule from a global analysis where KA and Δsmax of the probe-macromolecule complex, are shared parameters between curves (they are not pre-determined fixed parameters). Besides, standard deviation between replicates is taken into account in the fitting process. Ultimately, these tools provide a more robust analysis and reliable characterization of binding interactions monitored through competitive assays.


Try AFFINImeter Spectroscopy

Acknowledgements


We would like to thank Dr Pedro Nieto Mesa and Dr José Luis de Paz Carrera from the Institute of Chemical Research (IIQ) of the Spanish National Research Council (CSIC), for kindly share with us the FP data presented herein.


References & Notes


1 Hall, M.; Yasgar, A.; Peryea, T.; Braisted, J.; Jadhav, A.; Simeonov, A.; Coussens, N. Fluorescence Polarization Assays In High-Throughput Screening And Drug Discovery: A Review. Methods and Applications in Fluorescence 2016, 4, 022001.

2 This figure has been taken from http://glycoforum.gr.jp/science/word/glycotechnology/GT-C06E.html.

3 a) Solera, C.; Macchione, G.; Maza, S.; Kayser, M.; Corzana, F.; de Paz, J.; Nieto, P. Chondroitin Sulfate Tetrasaccharides: Synthesis, Three-Dimensional Structure And Interaction With Midkine. Chemistry – A European Journal 2016, 22, 2356-2369; b) Maza, S.; Gandia-Aguado, N.; de Paz, J.; Nieto, P. Fluorous-Tag Assisted Synthesis Of A Glycosaminoglycan Mimetic Tetrasaccharide As A High-Affinity FGF-2 And Midkine Ligand. Bioorganic & Medicinal Chemistry 2018, 26, 1076-1085.

4 The competitor is a synthetic disulfated disaccharide described in ref. 3b as compound 18.

5 These model were created with the “model builder” tool, exclusive of AFFINImeter. For more information go to AFFINImeter knowledge center.
What you have learned of Isothermal Titration Calorimetry with AFFINImeter in 2015?

AFFINIMETER_NAVIDEÑO_20164cm

What you have learned of Isothermal Titration Calorimetry with AFFINImeter in 2015?

The best gift we can get these holidays is to see that our support has helped your research, leading to improved scientific publications, PhD thesis, and increased research projects successfully accomplished… Happy Holidays!!

AFFINImeter is currently the best  software for the analysis of Isothermal Titration Calorimetry data to obtain a complete thermodynamic and kinetic characterization of molecular interactions. If you are already an user  you are probably aware of all this information, anyway,  we thought that you would like to have a compilation of all the resources we have developed for divulgation and didactic purposes during this year 2015!

For the upcoming year we promise you plenty of new features and improvements in AFFINImeter!

5 Ways in which AFFINImeter can improve your research!

  1. Get more citations from your publications.
  2. Harness the full interpretation of your data
  3. Save time and Material
  4. Get kinetics information from your new and old ITC files
  5. Leave no any ITC isotherm without a fitting. (Read here)

What is the Model Builder?

As you must know with AFFINImeter  complex reaction schemes can be written to describe a real scenario in chemical language. AFFINImeter provides an exclusive “Model Builder” to write the chemical equations describing your system. We have shown you how to take advantage of the model builder.
competitive-interaction-model-ITC

  1. Representative binding models based on a Stoichiometric equilibria and Independent sites approach.
  2. Stoichiometric and site constants: two approaches to analyze data with AFFINImeter.
  3. The stoichiometric equilibria approach to design binding models with AFFINImeter
  4. The independent sites approach to design binding models with AFFINImeter

Guide and tutorial of How to perform a Global analysis with AFFINImeter?

Global fitting reaction parameters 13012015

Complex binding models are usually described by many variable parameters and, in such cases, a single experimental curve is insufficient to achieve a robust analysis. During this year we have prepared several cases of use to show you how to solve easily complex fitting analysis, for instance a global fitting of several ITC isotherms.

KinITC: Get all the kinetic information from your ITC raw data!

We have implemented KinITC, this is a methodology recently developed by Philippe Dumas (CNRS, France) to simultaneously get kinetic and thermodynamic information from a standard ITC experiment. With one single titration experiment it calculates the kinetic constants (kon and koff) and the thermodynamic data (KD and ΔH) of 1:1 binding interactions. The current implementation of kinITC in AFFINImeter is valid only for 1:1 interactions but we intend to extend this for more complex systems in the near future.

Did you miss our Webinars? Here you can get the slides of the presentations!

Malvern Webinar:

AFFINImeter was guest presenter of the Malvern webinar on advanced Isothermal Titration Calorimetry (ITC) data analysis. (Read more).

 UNAM webinar:
The following slides corresponds to different webinars that we have done for research groups interested in learning more about AFFINImeter.

Selected AFFINImeter publications

Global parameters and reaction parameteres

Global parameters

Fitting parameters accounting for experimental artifacts that have an effect on the ITC isotherm

Qdil: corrects for the molar enthalpy of dilution of the injected solute, this is generally required when no complementary dilution experiment (with the pure solvent in the cell) were performed and subtracted from a binding experiment

Qdb: corrects for a potential baseline shift, generally due to external (not specific from the studied system) physical phenomena

r(M), r(A), r(B): scaling parameters empllyed to correct potential differences between nominal and true concentration of compounds M, A and B, respectively. The “r” parameter multiplied by the nominal concentration yields the true concentration (i.e. r(A)=0.9 indicates that the real concentration of the main compound in the sample cell “A” is 0.9 times the nominal concentration).

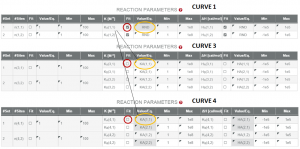
Value/eq: initial guess or “seed” value. This field can be left as random (RND), it can be filled with a number or, with an equation that relates it to another parameter of the fit subproject.

Min-Max: set the upper and lower limits of the fitting parameter.

Fit: check this option for a particular parameter if you want to fit it during the analysis. Uncheck it if you want to set the parameter as a constant value (specified in the value/eq field).


Reaction parameters

Fitting parameters of the thermodynamic data associated with the equilibria described in the binding model selected.

Ka: Association constant

ΔH: Binding enthalpy

Value/eq: initial guess or “seed” value. This field can be left as random (RND), it can be filled with a number or, with an equation that relates it to another parameter of the fit subproject.

Min-Max: set the upper and lower limits of the fitting parameter.

Fit: check this option for a particular parameter if you want to fit it during the analysis. Uncheck it if you want to set the parameter as a constant value (specified in the value/eq field).

Extending ITC to Kinetics with kinITC


Title: Extending ITC to Kinetics with kinITC

Authors: Philippe Dumas, Eric Ennifar, Cyrielle Da Veiga, Guillaume Bec, William Palau, Carmelo Di Primo, Angel Piñeiro, Juan Sabín, Eva Muñoz, Javier Rial.

Abstract:

Isothermal titration calorimetry (ITC) has long been used for kinetic studies in chemistry, but this remained confined to enzymatic studies in the biological field. In fact, the biological community has long had the tendency of ignoring the kinetic possibilities of ITC considering it solely as a thermodynamic technique, whereas surface plasmon resonance is seen as the kinetic technique par excellence. However, the primary signal recorded by ITC is a heat power which is directly related to the kinetics of the reaction. Here, it is shown how this kinetic signal can be recovered by using kinITC, the kinetic extension of ITC. The theoretical basis of kinITC is detailed for the most common situation of a second-order reaction A + B Ω C characterized by kinetic parameters kon,koff. A simplified kinITCETC method based upon the determination of an “Equilibration Time Curve” (ETC) is presented. The ETC is obtained by automatic determination of the “effective end” of each injection. The method is illustrated with experimental results with a comparison to Surface Plasmon Resonance (SPR) data. kon values were obtained in a wide range, from 103 to 0.5 × 106 M− 1 s− 1. All procedures were implemented in the program AFFINImeter (https://www.affinimeter.com/).

Get full Publication here.

KinITC Logo
KinITC


KinITC: Obtain Thermodynamic and Kinetic Data from your ITC Measurements in just five clicks

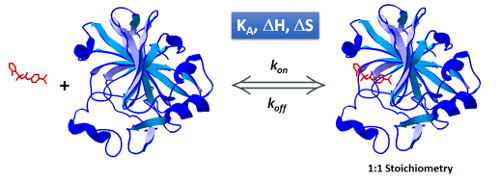
In AFFINImeter we have implemented KinITC, this is a new method to obtain kinetic information from Isothermal Titration Calorimetry Data. With one single titration experiment it calculates the kinetic constants (kon and koff) and the thermodynamic data (KD and ΔH) of 1:1 binding interactions.

Global fitting: the key for a robust analysis

The Indian parable of “the six blind men and the elephant” tells the story of six blind men who touch an elephant in the hope of learning what it is like. As each one can only feel a different part of the animal the individual conclusions obtained are in disagreement and none of them provides a real view of the full elephant. “only by sharing what each of you knows can you possibly reach a true understanding”; that´s the moral behind this nice story.

The six blind men and the elephant: only a global analysis of the overall data provides a true understanding

Sometimes, when we perform two or more ITC titration experiments of a complex interacting system under different experimental conditions (i.e. different concentrations and/or experimental setup) we find out that the individual analysis of the corresponding isotherms yields different values of the thermodynamic parameters. This result can be very confusing, especially for newcomers in the field of molecular recognition, because all these experiments are a representation of the same interaction and should converge to provide the same information. Frequently, the explanation for this behaviour is that each individual ITC experiment lacks of sufficient information to unequivocally determine the thermodynamic parameters of the binding event. “It´s like feeling only a separate part of the elephant”.
Analogous to the parable of the six men and the elephant, the way to get a true understanding of the binding event consist of the global analysis of the different isotherms.
Being aware of the relevance of global analysis, in AFFINImeter we count with the possibility to perform Global fitting of multiple dataseries (isotherms) to tailored binding models where one or more fitting parameters are shared between isotherms. The number and identity of the parameters shared are selected by the user. Moreover, two or more parameters can be related trough mathematical relationships designed by the user. All these features make our global fitting tool the most potent among others to perform a robust analysis of ITC data of complex interactions.

Learn how to perform a global analysis with AFFINImeter:

AFFINImeter guest presenter of the Malvern webinar on advanced Isothermal Titration Calorimetry (ITC) data analysis

Webinar on advanced Isothermal Titration Calorimetry (ITC) data analysis

The AFFINImeter team are guest presenters of the Malvern webinar on advanced Isothermal Titration Calorimetry (ITC) data analysis. Together we will show how the latest advances in the field of ITC data analysis enable users to “squeeze” the ITC isotherm(s) to get more information than just thermodynamic data and to expand the range of applications of ITC. This webinar will be very helpful for ITC users studying complex interactions, for those who are having difficulties with their data analysis, or simply want to take their analysis to the next level. It is of special interest relevant for researchers from academia and industry working in biomedical applications, particularly in the area of drug design.

(more…)

Thermodynamic and kinetic aspects of Molecular Recognition Processes

The understanding of molecular recognition processes requires a thorough examination from different perspectives including thermodynamic and kinetic aspects of the binding interaction and structural aspects of the interactants and the complex.

The determination of the binding affinity of two (or more) interactants (i.e. a protein/ligand system), through a steady state analysis provides information on how strong is the complex formed, and it is typically expressed in terms of equilibrium binding constants (association, KA , or dissociation, KD constants). The kinetic analysis of the interaction offers information on how fast the complex is formed and how fast it dissociates, expressed in terms of association and dissociation rate constants, respectively (kon and koff).

(more…)

Global fitting analysis of a protein-ligand binding experiment

Global fitting analysis of a protein-ligand binding experiment

A few weeks ago AFFINImeter launched an Isothermal Titration data Analysis challenge of the analysis of a protein-ligand binding experiments. The participant had to globally analyze a set of Isothermal Titration Calorimetry experiments using AFFINImeter and get the thermodynamic and structural parameters of the interaction between both molecules (the receptor protein and the ligand).

The participants in this contest had the opportunity to demonstrate their ability to propose the right model for a given binding isotherm as well as to get the corresponding parameters upon fitting using AFFINImeter. On their side, less experienced participants had the opportunity to:

The results recently published by Henlz et al in [Methods 59 (2013) 336-348] were taken as a reference to generate the set of ITC isotherms selected for this contest.

(more…)