5 Tips to optimize your ITC experiments for kinetic analysis.

Since the method KinITC was implemented in AFFINImeter many researchers have been using it to obtain kinetic information of binding interactions from ITC data; the good news is that no special experimental setup different from the standard ITC experiment is required to register data for kinetic analysis! The information is derived from analysis of the thermogram of regular ITC titrations and therefore one can obtain kinetic information from old ITC data right away.

There are few recommendations though if you are planning to perform new ITC experiments, focused on getting high-quality data for kinetic analysis:

1) Set the time between successive power measurements to 1s or 2s. This will give a better definition of the thermogram peaks and therefore a more precise calculation of the equilibration times.

2) Set the time recording the baseline before the first injection to 1 or 2 minutes. In order to have a good reference when determining the signal baseline.

3) Leave enough time between injections so that a full equilibration for the overall set of injections is registered.

4) Clean thoroughly the instrument before the experiment. This is fundamental to optimize the response time of the instrument, which strongly determines the sensitivity of the kinetic analysis.

5) A high gain feedback mode is recommended in order provide the fastest response time (but, be careful because a high feedback mode can also generate signal overshooting after injection, which greatly difficulties the kinetic analysis! If overshooting happens, don´t use high gain model).

Need more information about this subject? Contact the Scientific team of AFFINImeter at info@affinimeter.com.

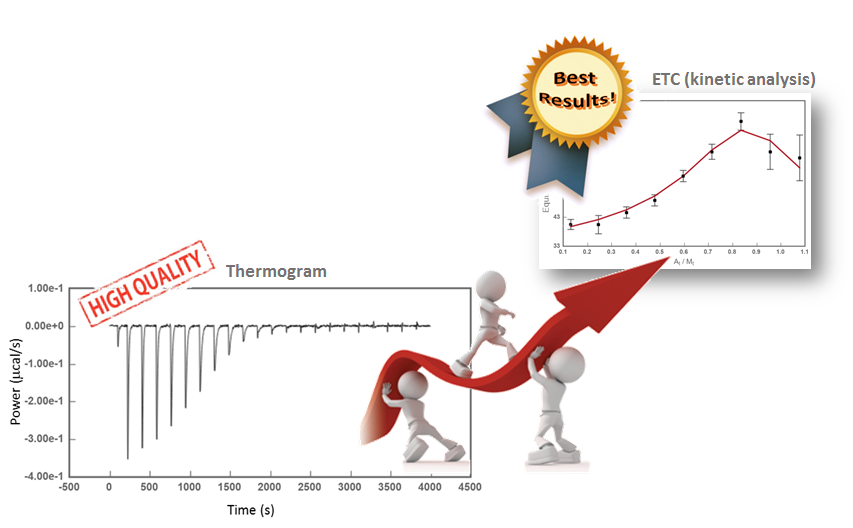
Follow these simple tips to increase the quality of your ITC data for kinetic analysis

Figure Junio2016

KinITC: Obtain Thermodynamic and Kinetic Data from your ITC Measurements in just five clicks

In AFFINImeter we have implemented KinITC, this is a new method to obtain kinetic information from Isothermal Titration Calorimetry Data. With one single titration experiment it calculates the kinetic constants (kon and koff) and the thermodynamic data (KD and ΔH) of 1:1 binding interactions.

Competitive Binding Assay

Competition assays

Competitive binding assays where two (or more) ligands bind to the same receptor have become common experiments in many research areas, from basic investigations to innovation in the pharmaceutical industry. These assays can be done in different formats, i.e. through a displacement assay where ligand “L1” is displaced by ligand “L2” from a preformed complex “L1-receptor” or via titration of a receptor solution with a mixture of L1 +L2. Either way, the competitive binding assay provides rich thermodynamic and structural information of the various binding events taking place during the course of the experiment. Thus, Isothermal Titration Calorimetry (ITC) competition assays performed in a displacement format have been revealed as an efficient tool for the quantitative analysis of very high- / low- interactions, with application in the field of fragment based drug screening (ref).

Analysis of competition experiments with AFFINImeter

The versatility of the experimental setup in AFFINImeter-ITC permits the analysis of ITC competition experiments in its various formats. As an illustration, the following lines describe the analysis of an ITC isotherm resulting from a competitive experiment where a solution of a receptor in titrated with mixture of two competing ligands.

AFFINImeter contains a series of examples with which users can practice and learn the overall process of data fitting: from equipment and data uploading to fitting model design and data fitting.

In this post we will review an example of a competitive model fitting model used to analyze the experiment data of two ligands in the syringe competing for binding to the same receptor.

Practical case: competitive binding model

The AFFINImeter example “competitive binding model” illustrates an ITC experiment where two ligands, “A” and “B” compete with each other for binding to the receptor “M”.

Drawing of a competitive binding model
Competitive Binding model scheme

This situation corresponds to a binding model consisting of three free species (A, B and M) two binding equilibria representing the interaction of M with A and M with B

The model was designed with the “reaction builder” and stored in “models”.The equipment used is decribed and stored in “equipments”. The dataseries is uploaded and stored in “dataseries”. When the dataseries is uploaded, the user has to complete the information relative to the equipment used and the species concentration. In this particular case (where there is a competitor “B”).

How to fit a project with AFFINImeter


1- Go to PROJECT MANAGEMENT and create a new PROJECT an a new FIT SUBPROJECT.

  • Add the dataseries created previously to the subproject.
  • Select the model created previously.
  • Keep all the default values in FitSetting.

2- Press Run button.

This Steps are described in the following Video Tutorial:

You can follow this tutorial in AFFINImeter, the Experimental Data and Binding model are stored in your own AFFINImeter account. If you hasn’t registered yet go to the AFFINImeter Software WebPage to get your account.


Ref: W. B. Turnbull, Divided we fall? Studying low-affinity fragments of ligands by ITC. GE Healthcare Life Sciences protocol, 2011, pp 1-11.