Download AFFINImeter ITC Advanced for Windows

We’ve released AFFINImeter ITC Advanced 1.2.0 for Windows

Do you want to install and use AFFINImeter in your computer? Now you can.

Go ahead and download AFFINImeter ITC for Windows right now (only for 64 bits computers).
Upon download, all users will get a FREE 30 days trial version for AFFINImeter ITC Advanced, including: KinITC, ITC and TA data analysis, Model builder, Design complex fitting and simulation projects for ITC, and a new tool: the rawdata experiments simulator.

Users who purchased a license for the web version have the same license for the Windows version. Just contact us at info@affinimeter.com to activate it.


Release notes for 1.2.0 (Update is recommended):

Important updates have been performed in the windows version of the AFFINImeter-ITC software. 

The analysis has implemented the accurate determination of concentrations recently published by Philippe Dumas: (see https://www.biorxiv.org/content/10.1101/512780v1.full).

This update breaks backwards compatibility: this means that all previously created projects (.affprojects) will not be compatible with this version (they will not load in the application or will throw some errors). The previously processed itc/ta raw data should be processed again to update the accurate calculation of concentrations in the equilibrium isotherm.

Other problems/issues fixed:

  • [Fixed] Fitting Projects Output may show incorrect results while performing complex fittings.
  • [Added] Fitting Projects now have an option to download a ZIP file containing all charts in the project, and also some new and specific ones.
  • [Added] Presentation of local minima for fitting projects was improved.
  • [Added/Fixed] Y labels, ticks and names
    • Y values/ticks will have an exponential format instead of the SI prefixes
    • Some Y label names were fixed
  • [Fixed] “Auto” setting in KinITC will stay active after deleting points in the Isotherm, if user the user has it active. Previously, after changing/deleting points in the isotherm, that setting was lost.
  • [Added] Included more references in the Help Section

Global fitting: the key for a robust analysis

Download use case: Global Fitting


The Indian parable of “The six blind men and the elephant” tells the story of six blind men who touch an elephant in the hope of learning what it is like. As each one can only feel a different part of the animal the individual conclusions obtained are in disagreement and none of them provides a real view of the full elephant. “only by sharing what each of you knows can you possibly reach a true understanding”; that´s the moral behind this nice story.


Fig 1: The six blind men and the elephant: only a global analysis of the overall data provides a true understanding.

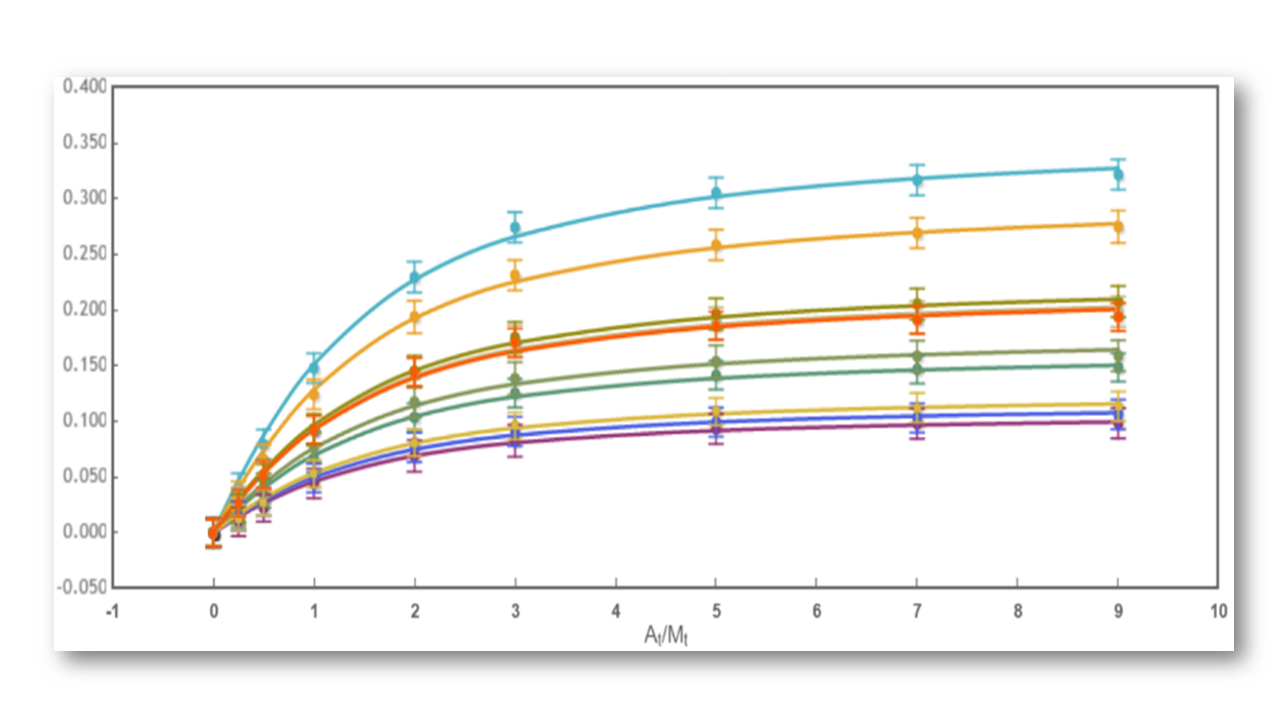
The binding assay(s) achieved to characterize a molecular interaction often provides not just one, but several binding curves from which the affinity constant is obtained.
Sometimes, an individual fit of these curves yield a set of binding constants that are significantly different from them; this result can be very confusing because, in principle, these binding curves are a representation of the same binding event and should converge to provide the analogous information. Often, the explanation for this behaviour is that the different curves indeed provide only partial and/or different information of the interaction, not enough to unequivocally determine the binding affinity through individual analysis.


“It´s like feeling only a separate part of the elephant”


This is a typical scenario when facing the study of complex binding events that involve more than one equilibrium and several binding curves are obtained, i.e. from different frequencies of the spectra in a titration experiment, from data registered using different techniques (ITC, NMR, Optical Spectroscopies…) and/or from experiments performed at different concentrations of the species participating in the binding event.


Analogous to the parable of the six men and the elephant, the way to get a true understanding of the binding event consist of the global analysis of the different curves.

Fig 2: The binding curve obtained from 2D NMR titrations.


Being aware of the relevance of global analysis, in AFFINImeter we count with the possibility to perform Global fitting of multiple data to tailored binding models where one or more fitting parameters are shared between isotherms. The number and identity of the parameters shared are selected by the user.
Moreover, two or more parameters can be related through mathematical relationships designed by the user. All these features make our global fitting tool the most potent among others to perform a robust analysis of binding data of complex interactions.

About the disuses of  Isothermal Titration Calorimetry in drug discovery research

Isothermal Titration Calorimetry (ITC) is the gold standard for the calculation of affinity in molecular interactions. Many times, researchers claim that the high consumption of sample does not offset the use of ITC for Kd calculation.
Conversely, ITC hides many surprises in the acquisition data that can provide more information in a single experiment that other techniques that are more expensive and more complicated to use.

Download the PDF file of Implementation of kinITC into AFFINImeter


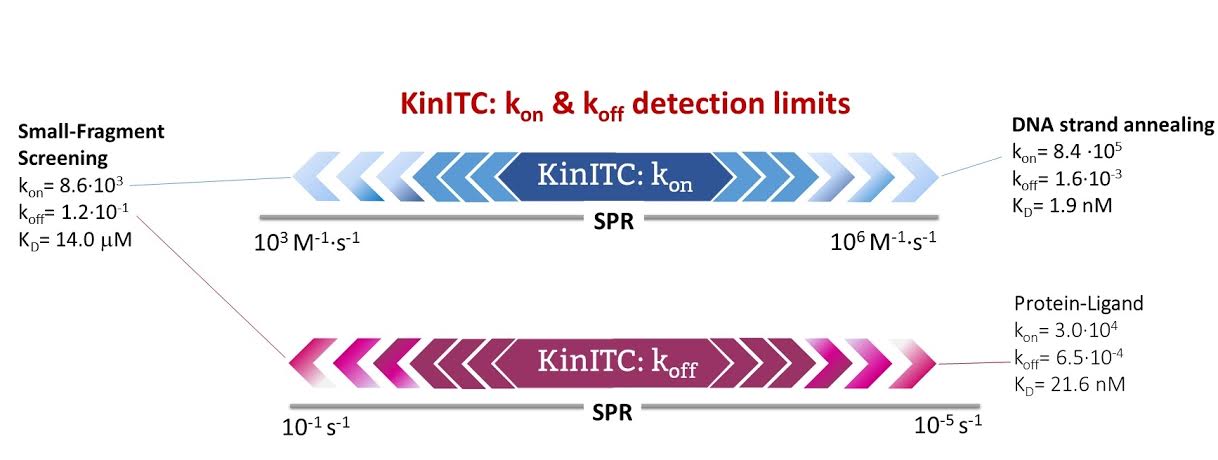
1. ITC collects data from the interaction as a function of time that can be analyzed to obtain kinetic information (kon and koff values). It can cover a very similar range as Surface Plasmon Resonance in a “label-free” and “in-solution” manner (Fig 1).

2. ITC can also provide valuable information about the mechanism of interaction. The high sensitivity of the ITC sensor makes it sensitive to more intriguing interactions as conformational changes, cooperativity…

Using a global fitting approach for the analysis of the isotherms and a model builder to create tailored binding models, the different mechanisms of interaction can be confirmed and characterized.

Find attached a couple of publications describing the application of this new method for ITC data analysis:

Download the PDF file of Implementation of kinITC into AFFINImeter


The concepts of stoichiometric and site binding constants

Download: The concepts of stoichiometric and site binding constants

The interaction between a monovalent ligand L and a multivalent receptor R involves the presence of various species, including the complex of R fully saturated with a number of ligands, and intermediate complexes of R partially saturated. This scenario can be described in terms of reaction schemes following two approaches:


  1. Based on equilibria between existing stoichiometric species (Stoichiometric approach).
  2. Based on equilibria between L and specific interaction sites of R (independent sites approach).
For a better understanding, let´s consider a particular case where L binds to a bivalent receptor:

1. Stoichiometric approach

This approach uses reaction schemes based on equilibria between stoichiometric species and yields stoichiometric binding constants. A model based on stoichiometric equilibria is valid to fit data of both independent and non-independent events and therefore, it is of wider applicability.

Here, the reaction scheme includes a first equilibrium between the free species and the intermediate RL and the second equilibrium between RL + L and RL2 (Fig. 1). The corresponding binding constants, K1 and K2, are denominated stoichiometric binding constants since they refer to equilibria between stoichiometric species.


2. Independent site approach

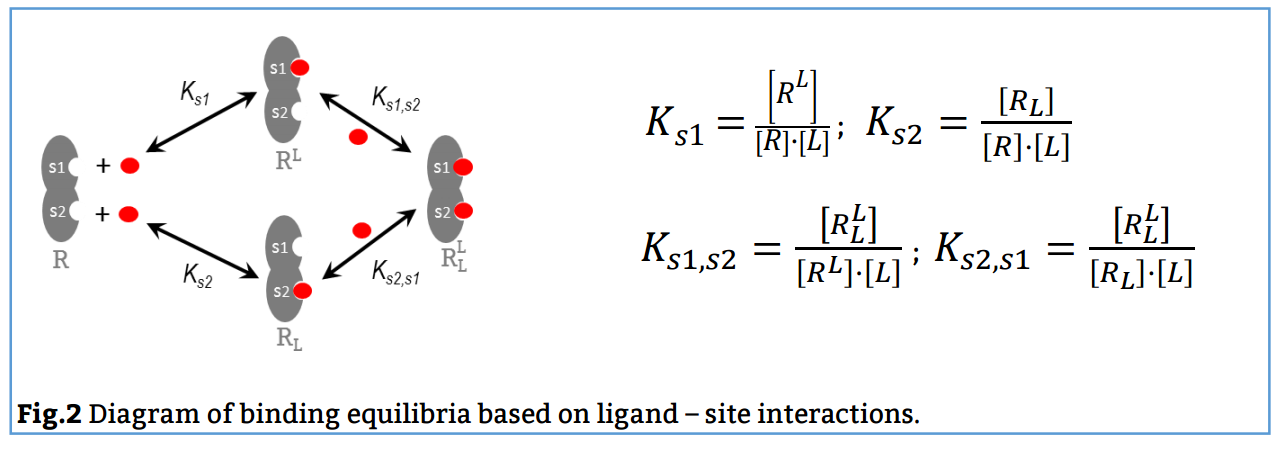
This approach uses a reaction scheme based on the binding of the ligand to individual sites present in the receptor and considering that all the sites are independent; thus, it supplies site binding constants.

In this case, the reaction scheme considers the presence of two sites in the bivalent receptor and two intermediate complexes (R, L and RL) formed when the ligand binds to s1 or s2 and consequently, the existence of a total of 4 equilibria (Fig. 2). The corresponding binding constants, Ks1, Ks2, Ks1s2 and Ks2s1, are denominated site binding constants since they refer to equilibria between L each specific site of R.


If you want to know more about how to get the stoichiometry (number of sites) and site binding constants with the independent sites approach you can click on the following button:


How to get the most out of biophysical techniques to address binding interactions?

The analysis of isotherms is the more direct way to calculate binding constants for molecular interactions. Isotherms can be obtained using different techniques (ITC, SPR, NMR, Uv-vis, IR, Fluorescence, Circular Dichroism…) and at different experimental conditions.

TRY AFFINImeter

1. The global fitting approach allows to simultaneously analyze several isotherms obtained by different biophysical techniques and/or at different experimental conditions in a very accurate manner.


2. Many interacting systems do not bind with a simple 1:1 model, more complex binding model can be designed to address complex interaction

3. Using tools to globally analyze isotherms obtained by different biophysical techniques is the most reliable method to characterize binding interactions by the orthogonal approach.

Click here to star using AFFINImeter and to start to create your own binding model:

TRY AFFINImeter


5 Tips to optimize your ITC experiments for kinetic analysis.

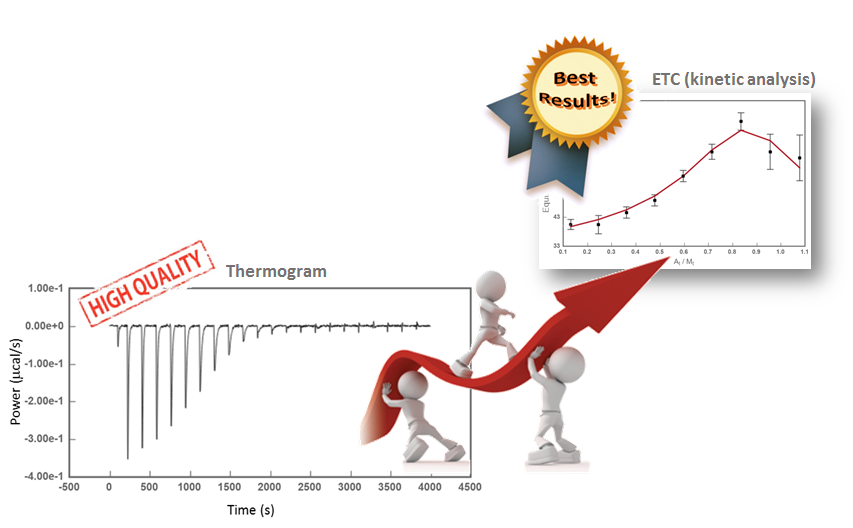
Since the method KinITC was implemented in AFFINImeter many researchers have been using it to obtain kinetic information of binding interactions from ITC data; the good news is that no special experimental setup different from the standard ITC experiment is required to register data for kinetic analysis! The information is derived from analysis of the thermogram of regular ITC titrations and therefore one can obtain kinetic information from old ITC data right away.

There are few recommendations though if you are planning to perform new ITC experiments, focused on getting high-quality data for kinetic analysis:

1) Set the time between successive power measurements to 1s or 2s. This will give a better definition of the thermogram peaks and therefore a more precise calculation of the equilibration times.

2) Set the time recording the baseline before the first injection to 1 or 2 minutes. In order to have a good reference when determining the signal baseline.

3) Leave enough time between injections so that a full equilibration for the overall set of injections is registered.

4) Clean thoroughly the instrument before the experiment. This is fundamental to optimize the response time of the instrument, which strongly determines the sensitivity of the kinetic analysis.

5) A high gain feedback mode is recommended in order provide the fastest response time (but, be careful because a high feedback mode can also generate signal overshooting after injection, which greatly difficulties the kinetic analysis! If overshooting happens, don´t use high gain model).

Need more information about this subject? Contact the Scientific team of AFFINImeter at info@affinimeter.com.

Follow these simple tips to increase the quality of your ITC data for kinetic analysis

Figure Junio2016

Variable Temperature ITC analysis with AFFINImeter

Analysis of Variable Temperature Isothermal Titration Calorimetry experiments with AFFINImeter

Monitoring a binding event with Isothermal Titration Calorimetry at different temperatures provides a powerful framework for elucidating interesting characteristics of the interaction. Analysis of the isotherms obtained determines the dependence of the association constant (KA) and binding enthalpy (ΔH) with temperature, information that can reveal mechanistic aspects of the interactions, i.e. the existence of allosteric effects and conformational changes (1).

Moreover, kinetic characterization of the interaction at various temperatures gives information about transition state thermodynamics, by means of the dependence of the association and dissociation rate constants (kon and koff) with the temperature. This way, activation free energies of association and dissociation are resolved into its enthalpic and entropic components (2).

Obtaining the full thermodynamic and kinetic profile of 1:1 interactions in a single ITC experiment is now possible with AFFINImeter and KinITC; in order to further exploit the potential of our analytical tools we have recently incorporated a new functionality in AFFINImeter that automatically analyzes variable temperature isothermal Titration Calorimetry assays through Van´t Hoff Plot (Ln(KA) vs 1/T), temperature dependence of ΔH (that determines changes in heat capacity, ΔCp) and Eyring plots (Ln(kon) vs 1/T and Ln(koff) vs 1/T) (3).

AFFINImeter is the only software that provides thermodynamic and kinetic information from a single ITC titration; now incorporates the automatic analysis of variable-temperature experiments.  

You can use this feature for free during one month, go to AFFINImeter webpage.

References

  • Freiburger L, Auclair K, Mittermaier A. Global ITC fitting methods in studies of protein allostery. Methods 2015, 76, pp 149-161.
  • GE Healthcare application note 80. Transition state thermodynamics using Biacore T100, (2007).
  • Ladbury, J. and Doyle, M. (2004). Biocalorimetry 2. Chichester: Wiley.

KinITC for TA and MicroCal Calorimeters – New version Release!

During the last months we’ve contacted you asking your opinion and experience with the software. Thanks to all your suggestions and comments we have improved the previous version of the software to make it easier, faster and more versatile.

What’s new in AFFINImeter?

  • Availability of KinITC for TA and Microcal data files.
  • Inclusion of Multi Temperature Analysis: Van’t Hoff and Eyring plots
  • The project management section has improved, now you can easily organize your projects in Folders/Subfolders and move them from one to another.


Easier, Faster and more Versatile!

In this new version you will find several changes adressed to improve the user experience of the software, adding more features, making it easier and faster to user, and more versatile.


Go to the software!

Expanding the range of applications of ITC in the Pharmaceutical Industry with AFFINImeter: A practical Case.

Many Drug–receptor interactions are characterized by complex binding modes that are far away from the behavior of a standard 1:1 model. This is the case of Heparin (Hp), one of the most commonly prescribed anticoagulant drugs, which exerts its effect through its interaction with the serine protease Antithrombin (AT-III). Hp is a linear heterogeneous polysaccharide containing a specific pentasaccharide sequence that binds AT-III with high nanomolar affinity (responsible for the anticoagulant activity); but AT-III also binds other Hp sequences with lower affinity. Determining the content of AT-III binding pentasacchride in Low Molecular Weight (LMW) Heparins is a requirement for Pharmaceutical companies that manufacture this type of anticoagulants; due to the intrinsic heterogeneity of Hp, obtaining this information it is not straightforward (1).

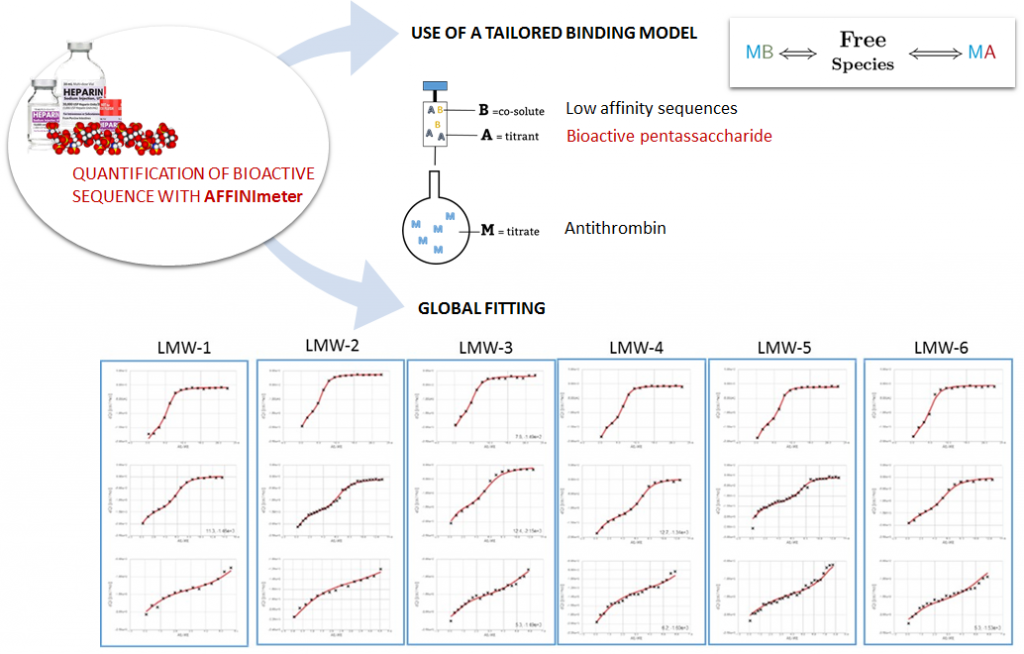
We have developed a new protocol based on ITC and AFFINImeter to determine the content of AT-III binding pentasaccharide in Heparins, which is summarized in the following scheme:

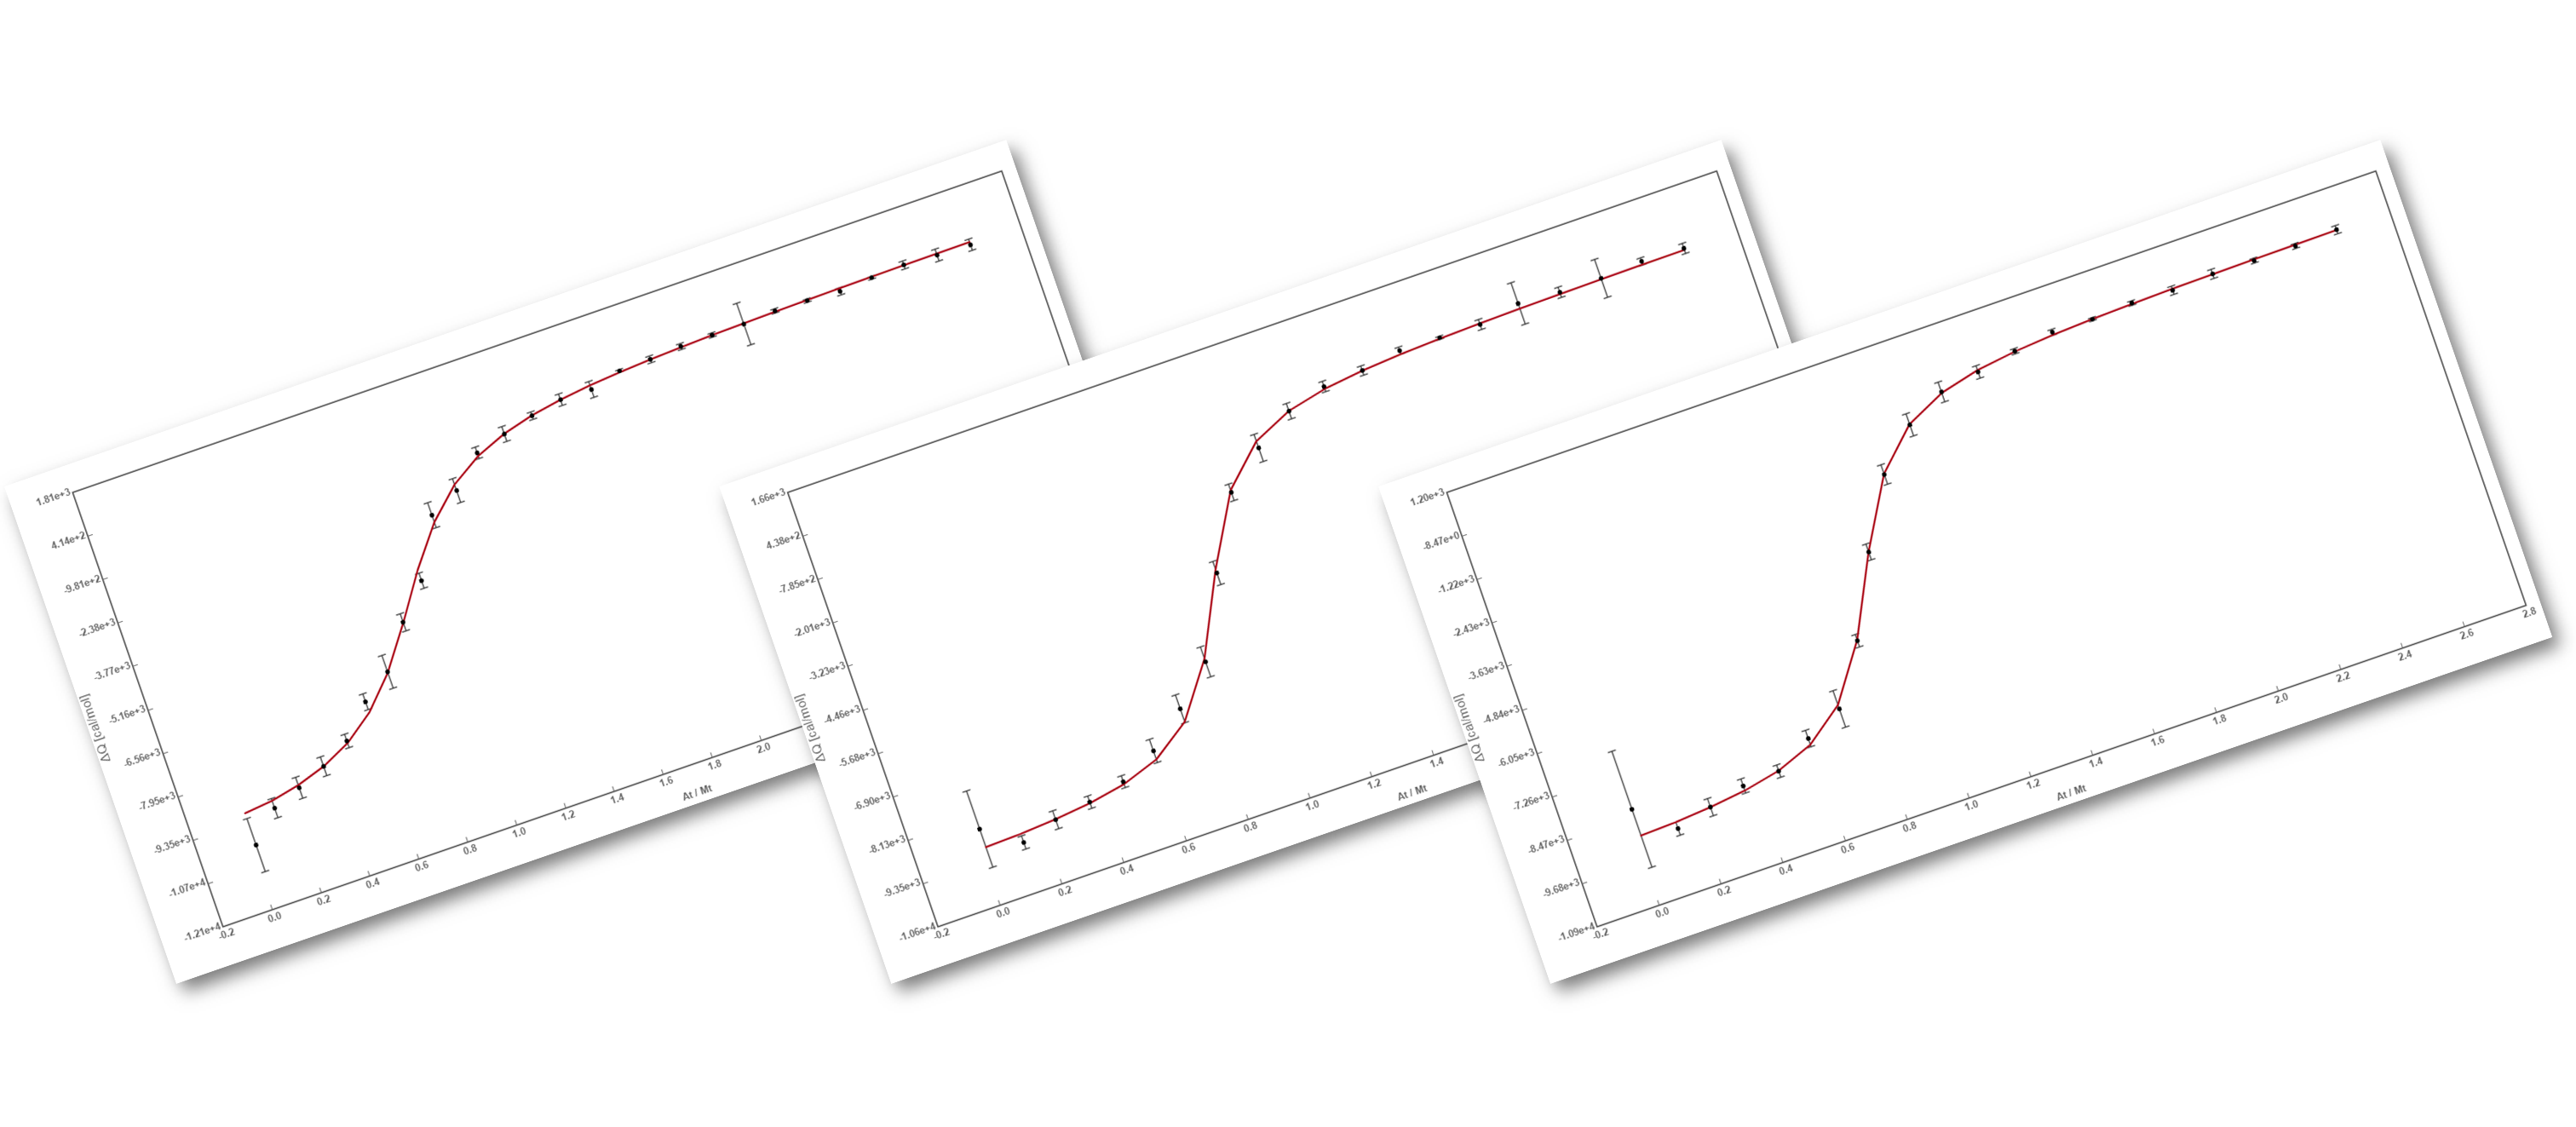
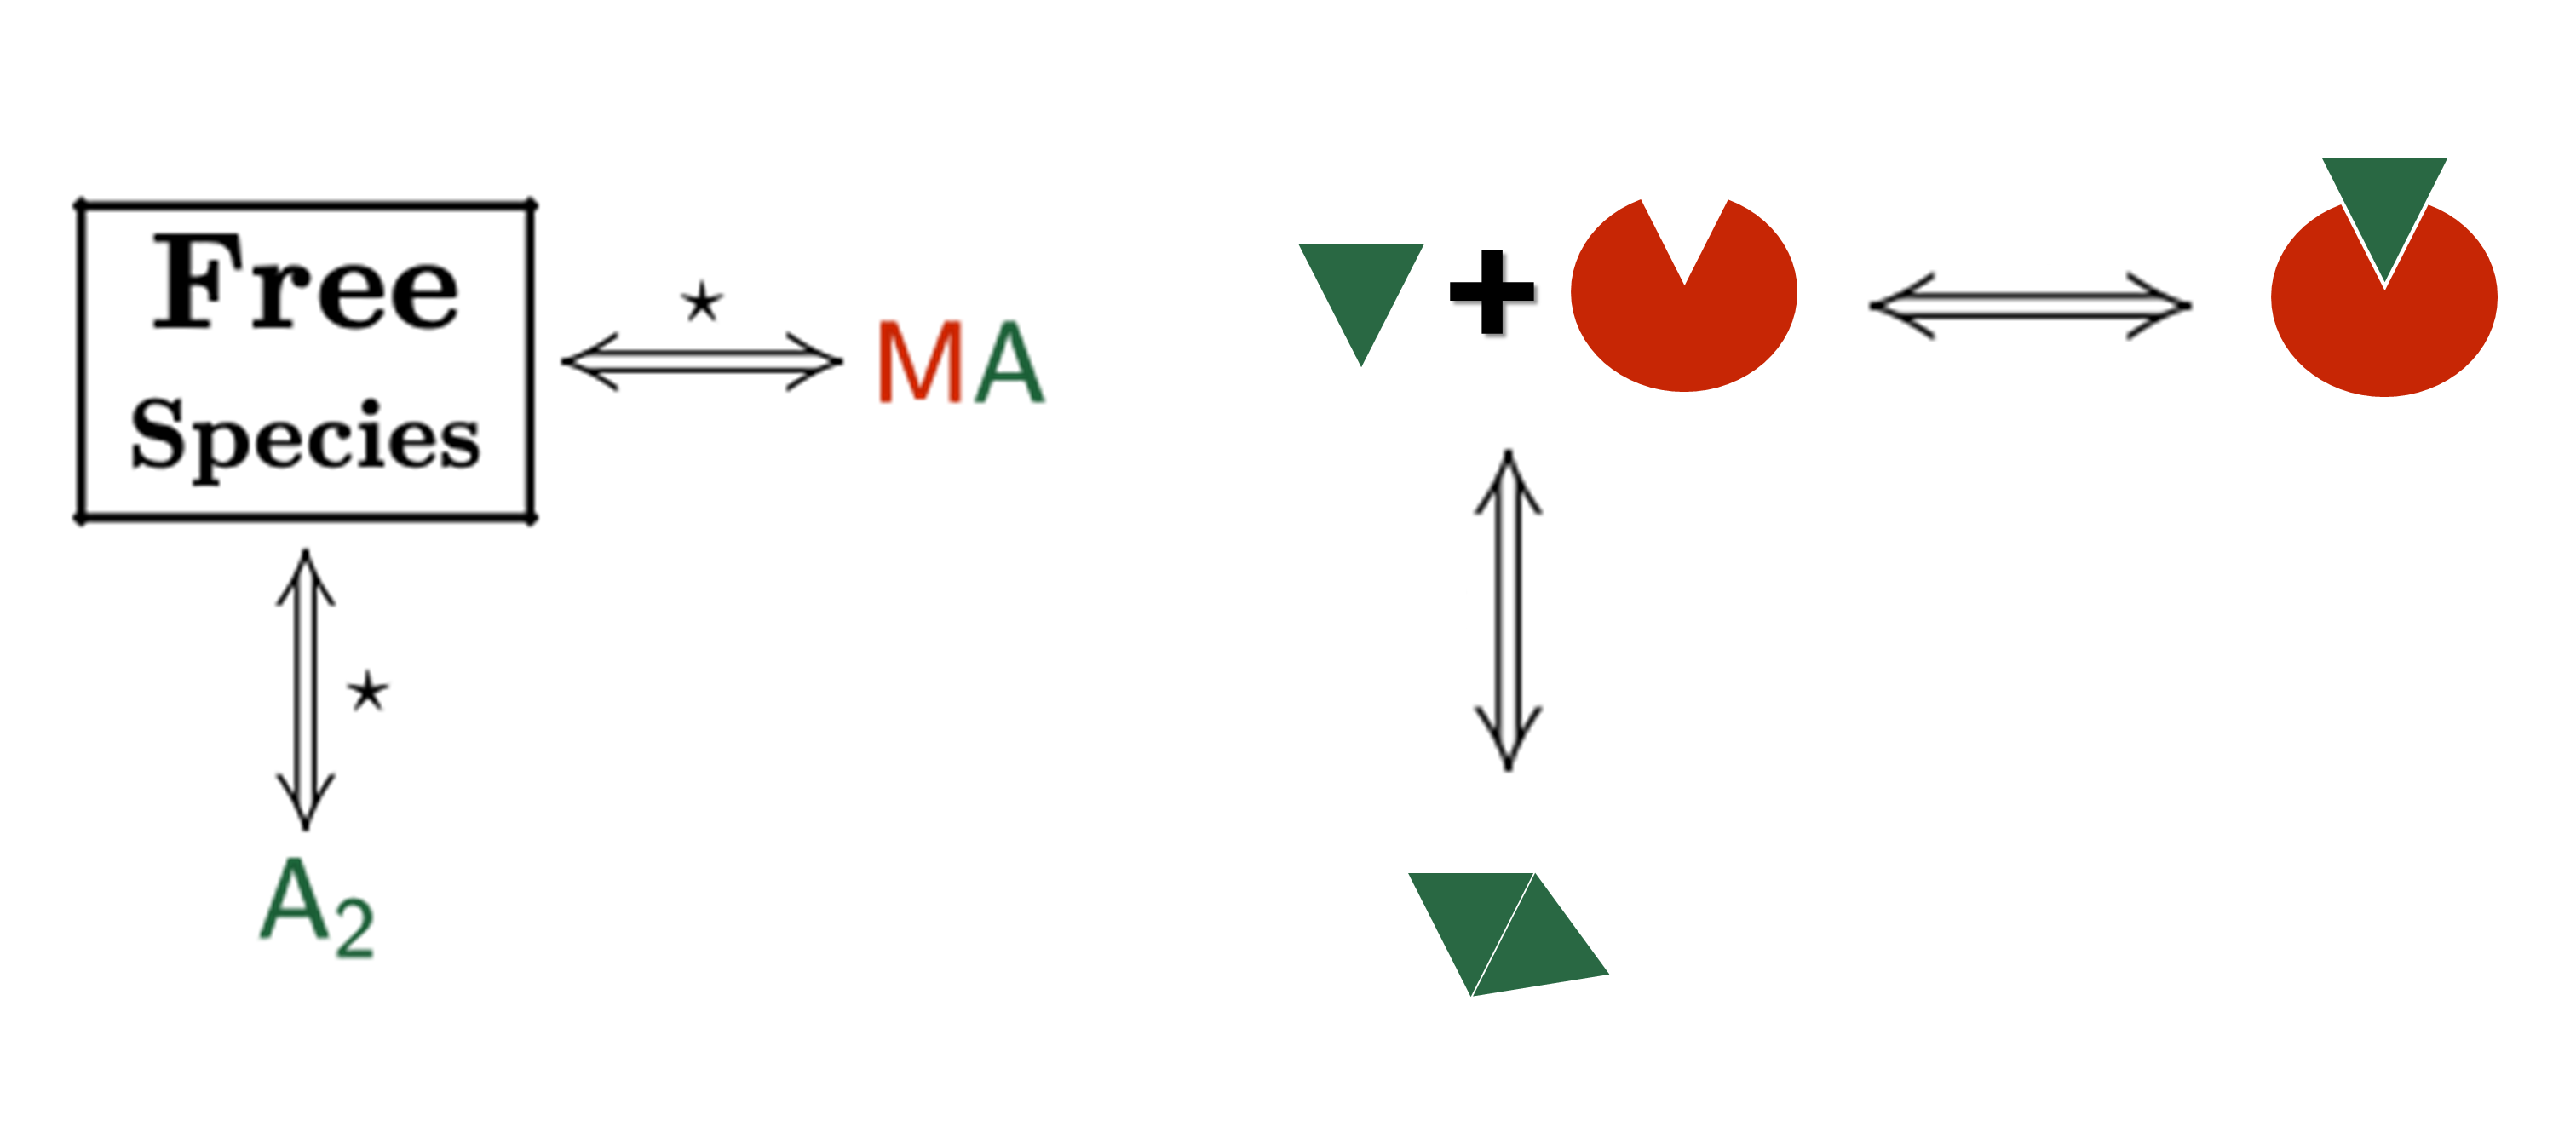
New method based on AFFINImeter to determine the content of AT-III binding pentasacchride in LMW Hp: 1) use of a tailored binding model that describes the competitive binding between the pentasaccharide (A) and other low affinity sequences (B) with AT-III (M); 2) global fitting of several isotherms registered under different Hp and or AT-III concentrations where the parameters rA and rB (that account for the fraction of A and B in the Hp sample) are fitting parameters and common among the different isotherms.


This method illustrates the great potential of the model builder and global fitting AFFINImeter tools to develop protocols of practical utility in the Pharmaceutical industry (2). We have successfully validated the protocol in the analysis of unfractionated Hp and a series LMW Hp in collaboration with the Pharmaceutical company Laboratorios Rovi (http://www.rovi.es/).

References

  1. Nandurkar H., Chong B, Salem H, Gallus A, Ferro V, McKinnon R. Low-molecular-weight heparin biosimilars: potential implications for clinical practice. Internal Medicine Journal, 2012, 44(5), pp 497–500.

  2. For a detailed description of the protocol contact us at support@affinimeter.com

Analysis of Variable Temperature ITC experiments: Temperature dependence of DH, Van’t Hoff’s and Eyring’s Plots

Information: Temperature dependence of ΔH

ΔH is a simple linear function of temperature, and the change in heat capacity, ΔCp, can be determined as the slope of a plot of ΔH values measured at different temperatures:

ΔH = ΔCp·T + ΔHTref

Where:

  • ΔH = Change in enthalpy between reactants and products* at temperature T
  • ΔHTref = Change in enthalpy at the reference temperature, Tref.
  • ΔCp = Change in heat capacity between reactants and products
  • Tref = Experimentl temperature closest to the average of all temperatures used.

Plot of ΔH vs T yields ΔCp (slope) and ΔHTref

* Note: For a binding equilibrium the reactants are the free species (i.e ligand and receptor) and the products are the complex(es) formed.


Information: Van’t Hoff plot

The Van’t Hoff equation is widely used to estimate the change in enthalpy, ΔH, and entropy, ΔS, between reactants and products* by measuring the equilibrium constant, KA, at different temperatures. The linear form of the Van’t Hoff equation is as follows:

Ln(KA)= −ΔH/RT + ΔS/R


Where T is the temperature (in kelvins) and R is the universal gas constant. This equiation assumes a linear relationship between Ln(KA) and 1/T and it applies when the change in heat capacity between reactants and products, ΔCp, is negligible.

The Van’t Hoff plot is the graph resulting of Ln(KA) plotted against 1/T. Knowing the slope and the intercept from this plot the values of ΔH and ΔS are determined as follows:

ΔH = −R·slope

ΔS = R·intercept


* Note: For a binding equilibrium the reactants are the free species (i.e ligand and receptor) and the products are the complex(es) formed.


Information: Eyring plot

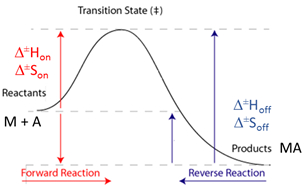
The Eyring equation describes the relationship between reaction rates (konand koff) and temperature and it is used to determine enthalpy and entropy of activation, ΔH‡ and ΔS‡, respectively. The linear form of the Eyring equation is as follows:

Ln(k/T)= −ΔH‡/RT + Ln(kB/h) + ΔS‡/R


Where k is the rate constant (kon or koff), T is the temperature (in kelvins), R is the universal gas constant, kB is the Boltzmann’s constant, h is the Planck’s constant, ΔH‡ is the enthalpy of activation and ΔS‡ is the entropy of activation.


The Eyring plot is the graph resulting of Ln(k/T) plotted against 1/T. Knowing the slope and the intercept from this plot, the values of ΔH‡ and ΔS‡ are determined as follows:

ΔH‡ = −R·slope

ΔS‡ = R·(intercept − Ln(kB/h))

When kon is used in the Eyring plot, ΔH‡ and ΔS‡ correspond to the enthalpy and entropy of activation from the reactants up to the transition state. Similarly, when koff is used in the Eyring plot, ΔH‡ and ΔS‡ correspond to the enthalpy and entropy of activation from the products up to the transition state


The Eyring plot.
The Eyring plot is the graph resulting of Ln(k/T) plotted against 1/T.