Information: Temperature dependence of ΔH
ΔH is a simple linear function of temperature, and the change in heat capacity, ΔCp, can be determined as the slope of a plot of ΔH values measured at different temperatures:
ΔH = ΔCp·T + ΔHTref
Where:
- ΔH = Change in enthalpy between reactants and products* at temperature T
- ΔHTref = Change in enthalpy at the reference temperature, Tref.
- ΔCp = Change in heat capacity between reactants and products
- Tref = Experimentl temperature closest to the average of all temperatures used.
Plot of ΔH vs T yields ΔCp (slope) and ΔHTref
* Note: For a binding equilibrium the reactants are the free species (i.e ligand and receptor) and the products are the complex(es) formed.
Information: Van’t Hoff plot
The Van’t Hoff equation is widely used to estimate the change in enthalpy, ΔH, and entropy, ΔS, between reactants and products* by measuring the equilibrium constant, KA, at different temperatures. The linear form of the Van’t Hoff equation is as follows:
Ln(KA)= −ΔH/RT + ΔS/R
Where T is the temperature (in kelvins) and R is the universal gas constant. This equiation assumes a linear relationship between Ln(KA) and 1/T and it applies when the change in heat capacity between reactants and products, ΔCp, is negligible.
The Van’t Hoff plot is the graph resulting of Ln(KA) plotted against 1/T. Knowing the slope and the intercept from this plot the values of ΔH and ΔS are determined as follows:
ΔH = −R·slope
ΔS = R·intercept
* Note: For a binding equilibrium the reactants are the free species (i.e ligand and receptor) and the products are the complex(es) formed.
Information: Eyring plot
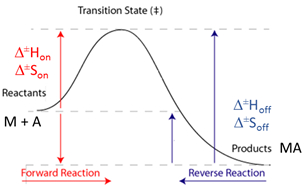
The Eyring equation describes the relationship between reaction rates (konand koff) and temperature and it is used to determine enthalpy and entropy of activation, ΔH‡ and ΔS‡, respectively. The linear form of the Eyring equation is as follows:
Ln(k/T)= −ΔH‡/RT + Ln(kB/h) + ΔS‡/R
Where k is the rate constant (kon or koff), T is the temperature (in kelvins), R is the universal gas constant, kB is the Boltzmann’s constant, h is the Planck’s constant, ΔH‡ is the enthalpy of activation and ΔS‡ is the entropy of activation.
The Eyring plot is the graph resulting of Ln(k/T) plotted against 1/T. Knowing the slope and the intercept from this plot, the values of ΔH‡ and ΔS‡ are determined as follows:
ΔH‡ = −R·slope
ΔS‡ = R·(intercept − Ln(kB/h))
When kon is used in the Eyring plot, ΔH‡ and ΔS‡ correspond to the enthalpy and entropy of activation from the reactants up to the transition state. Similarly, when koff is used in the Eyring plot, ΔH‡ and ΔS‡ correspond to the enthalpy and entropy of activation from the products up to the transition state
