AFFINImeter is on sales!


This month we have prepared a special offer just to let you exploit the full potential of AFFINImeter:

 15 % off in our Advanced plans*.

Select the technique AFFINImeter Spectroscopy and/or AFFINImeter ITC.


… Use this coupon in our online shop and get right away your discount!

ER7DS30

To use our online shop it will be necessary to have an AFFINImeter account, to create one click here.

AFFINImeter Shop

Or if you prefer we can send you an official quotation, click on the button below:​

Get a Quotation


*The promotion is available until May 31st and applicable for all AFFINImeter Advanced plan (ITC and/or Spectroscopy) which duration is equal or greater 1 year. The advanced account includes Global fitting, access to complex binding models, Kinetic information (KinITC tool available for AFFINImeter ITC), orthogonal approach (Multitechnique analysis available in AFFINImeter Spectroscopy)...


Global fitting: the key for a robust analysis

Download use case: Global Fitting


The Indian parable of “The six blind men and the elephant” tells the story of six blind men who touch an elephant in the hope of learning what it is like. As each one can only feel a different part of the animal the individual conclusions obtained are in disagreement and none of them provides a real view of the full elephant. “only by sharing what each of you knows can you possibly reach a true understanding”; that´s the moral behind this nice story.


Fig 1: The six blind men and the elephant: only a global analysis of the overall data provides a true understanding.

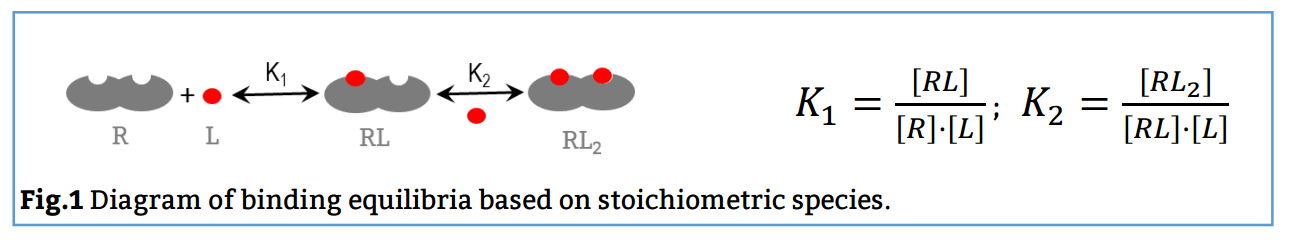
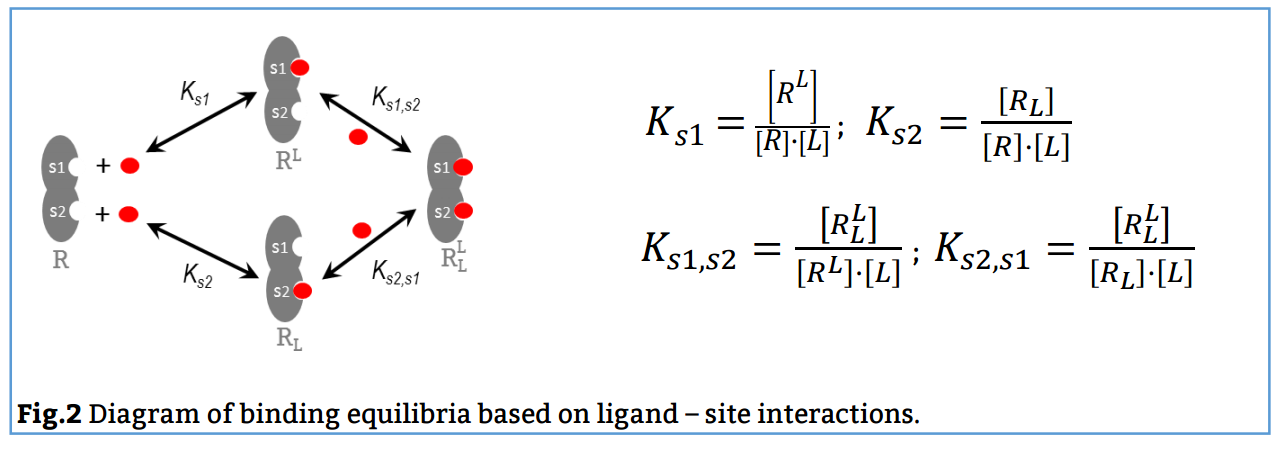
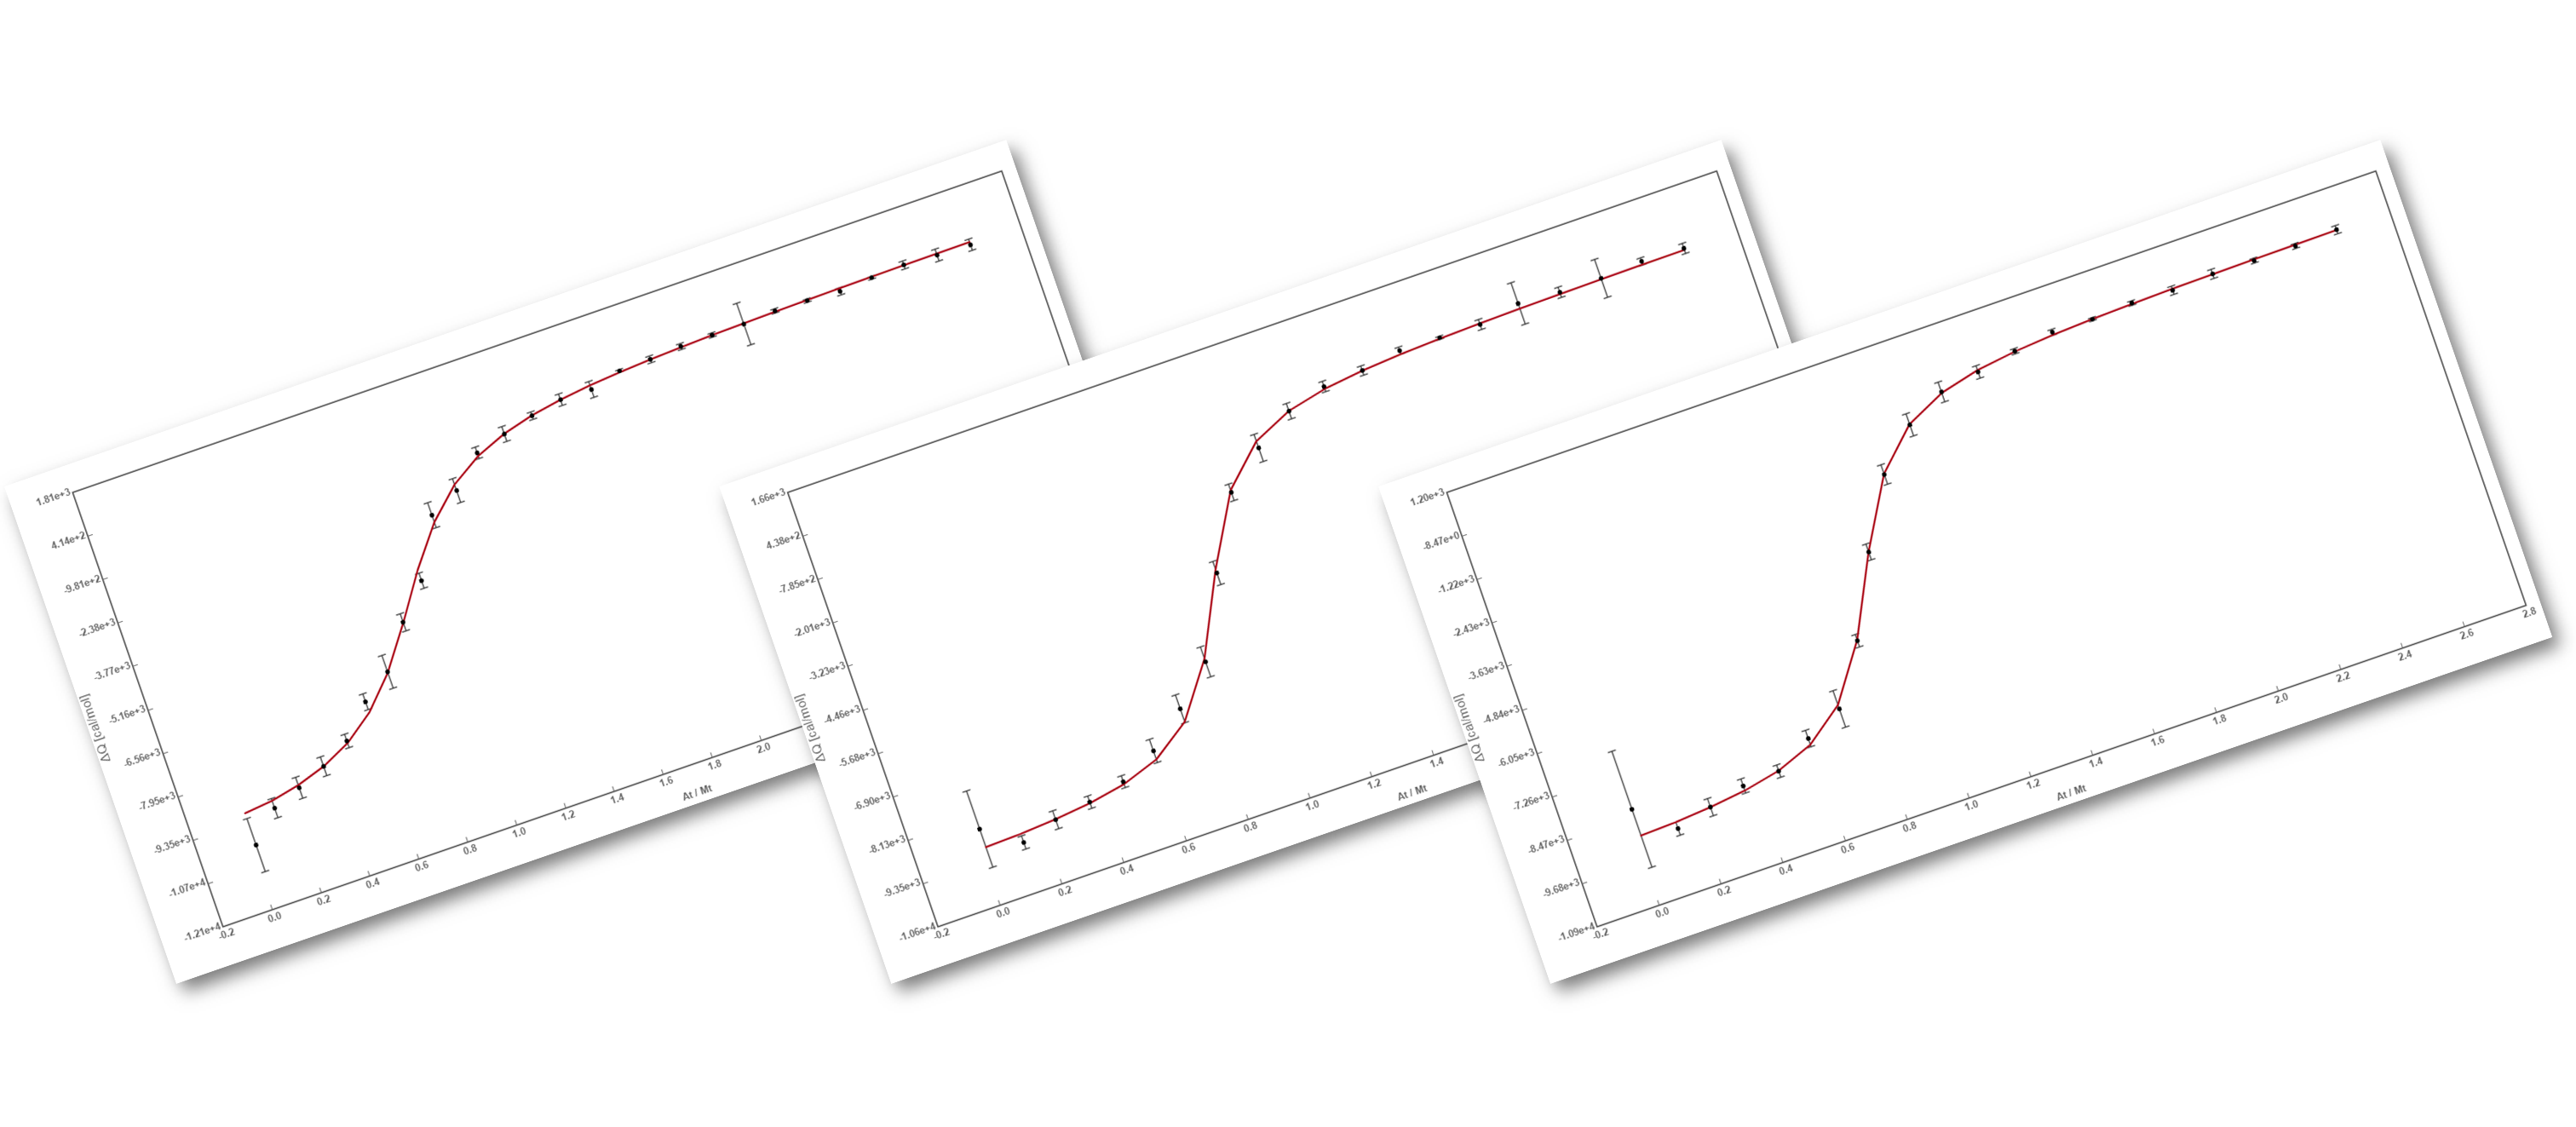
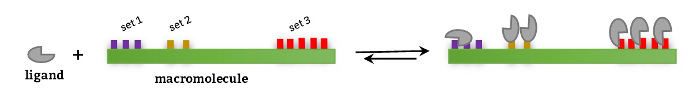
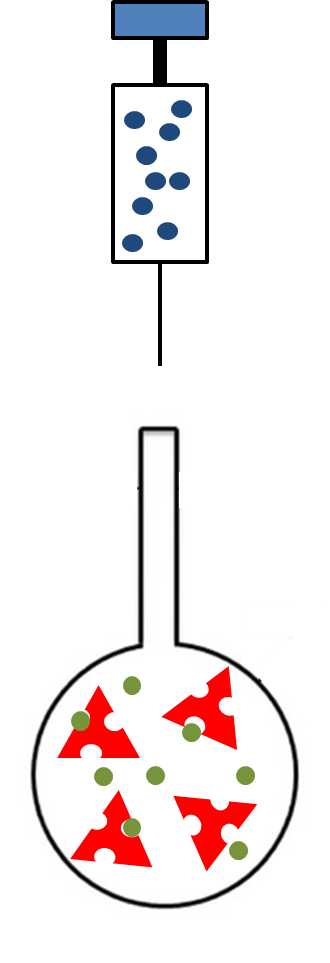
The binding assay(s) achieved to characterize a molecular interaction often provides not just one, but several binding curves from which the affinity constant is obtained.
Sometimes, an individual fit of these curves yield a set of binding constants that are significantly different from them; this result can be very confusing because, in principle, these binding curves are a representation of the same binding event and should converge to provide the analogous information. Often, the explanation for this behaviour is that the different curves indeed provide only partial and/or different information of the interaction, not enough to unequivocally determine the binding affinity through individual analysis.


“It´s like feeling only a separate part of the elephant”


This is a typical scenario when facing the study of complex binding events that involve more than one equilibrium and several binding curves are obtained, i.e. from different frequencies of the spectra in a titration experiment, from data registered using different techniques (ITC, NMR, Optical Spectroscopies…) and/or from experiments performed at different concentrations of the species participating in the binding event.


Analogous to the parable of the six men and the elephant, the way to get a true understanding of the binding event consist of the global analysis of the different curves.

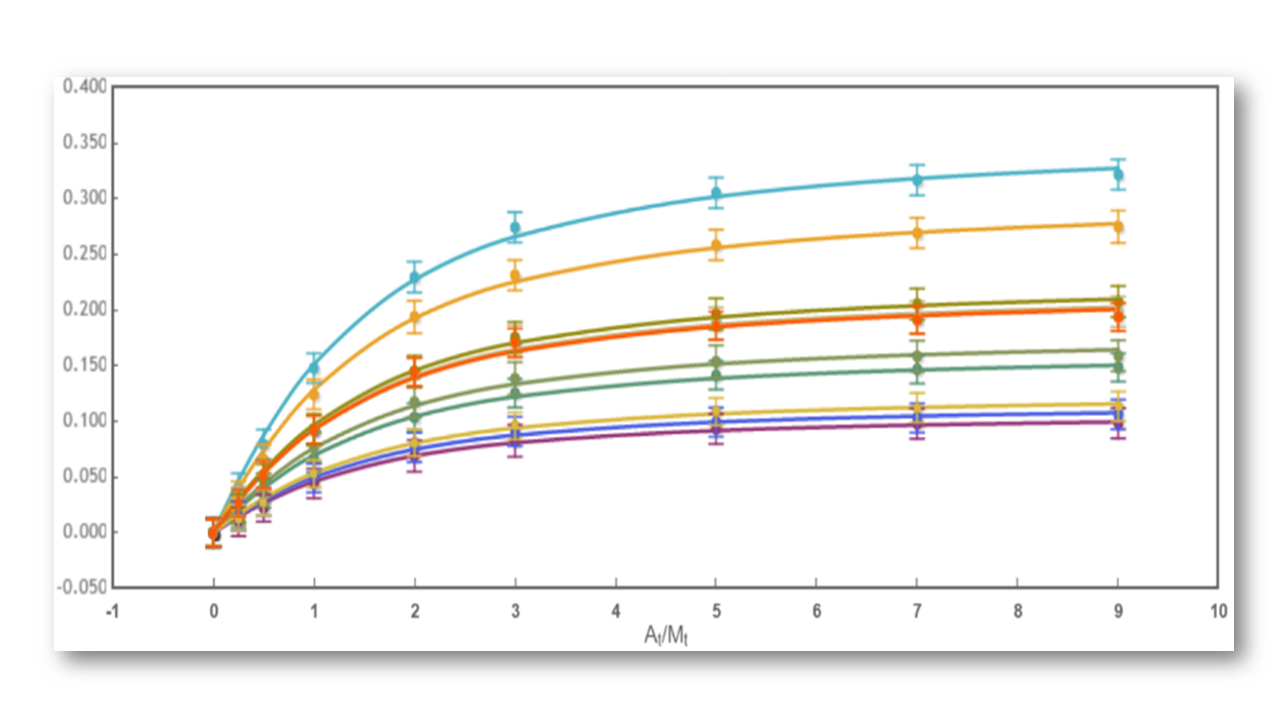
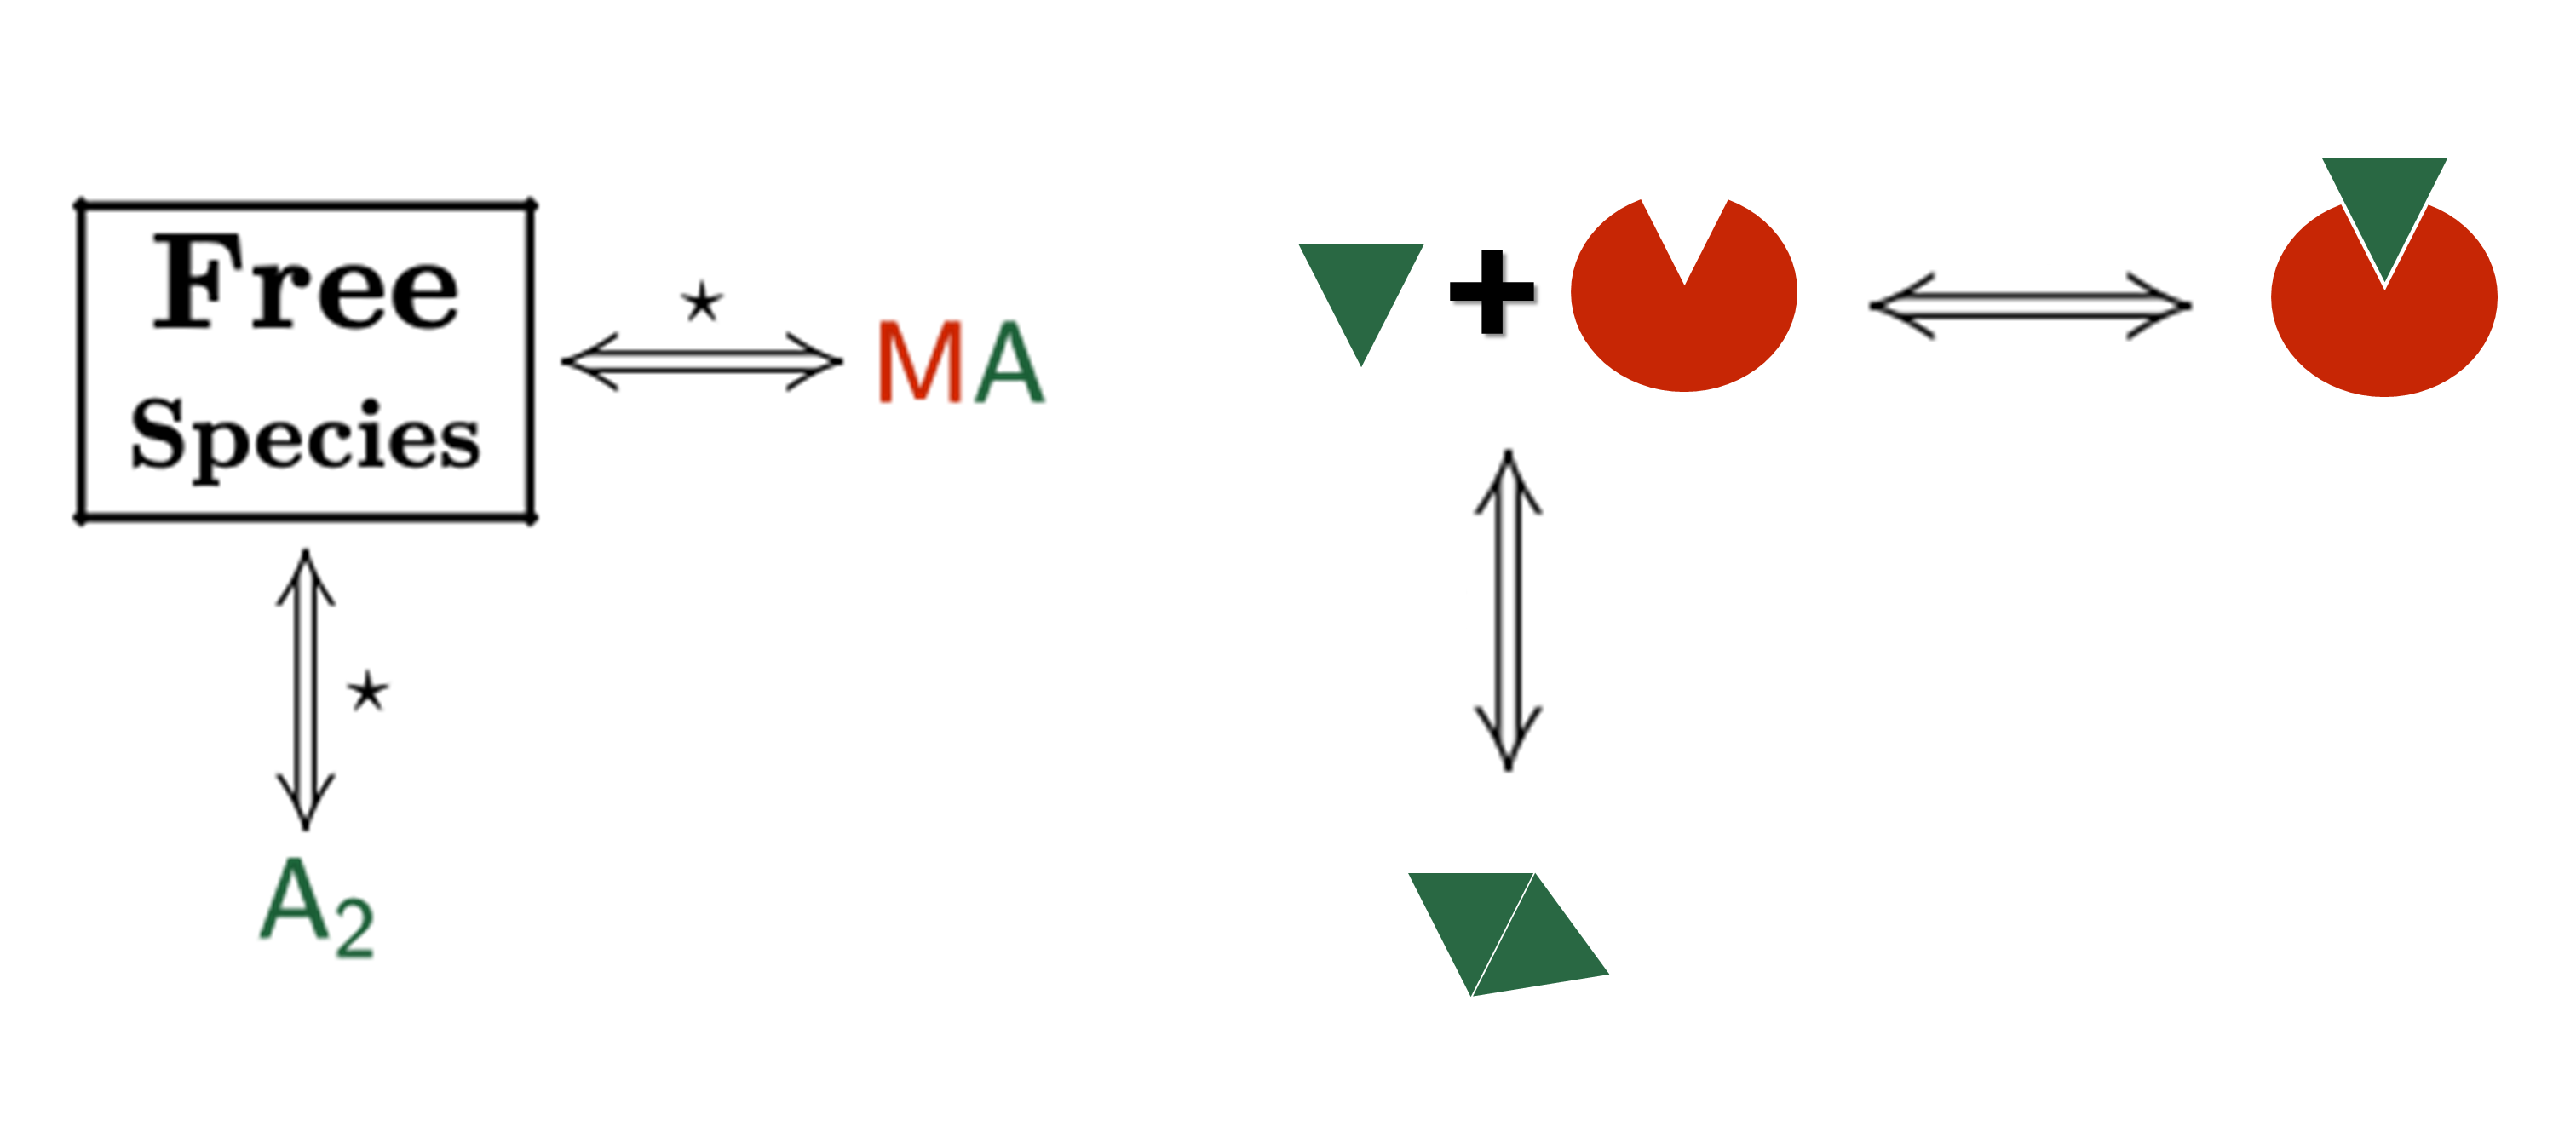
Fig 2: The binding curve obtained from 2D NMR titrations.


Being aware of the relevance of global analysis, in AFFINImeter we count with the possibility to perform Global fitting of multiple data to tailored binding models where one or more fitting parameters are shared between isotherms. The number and identity of the parameters shared are selected by the user.
Moreover, two or more parameters can be related through mathematical relationships designed by the user. All these features make our global fitting tool the most potent among others to perform a robust analysis of binding data of complex interactions.

The concepts of stoichiometric and site binding constants

Download: The concepts of stoichiometric and site binding constants

The interaction between a monovalent ligand L and a multivalent receptor R involves the presence of various species, including the complex of R fully saturated with a number of ligands, and intermediate complexes of R partially saturated. This scenario can be described in terms of reaction schemes following two approaches:


  1. Based on equilibria between existing stoichiometric species (Stoichiometric approach).
  2. Based on equilibria between L and specific interaction sites of R (independent sites approach).
For a better understanding, let´s consider a particular case where L binds to a bivalent receptor:

1. Stoichiometric approach

This approach uses reaction schemes based on equilibria between stoichiometric species and yields stoichiometric binding constants. A model based on stoichiometric equilibria is valid to fit data of both independent and non-independent events and therefore, it is of wider applicability.

Here, the reaction scheme includes a first equilibrium between the free species and the intermediate RL and the second equilibrium between RL + L and RL2 (Fig. 1). The corresponding binding constants, K1 and K2, are denominated stoichiometric binding constants since they refer to equilibria between stoichiometric species.


2. Independent site approach

This approach uses a reaction scheme based on the binding of the ligand to individual sites present in the receptor and considering that all the sites are independent; thus, it supplies site binding constants.

In this case, the reaction scheme considers the presence of two sites in the bivalent receptor and two intermediate complexes (R, L and RL) formed when the ligand binds to s1 or s2 and consequently, the existence of a total of 4 equilibria (Fig. 2). The corresponding binding constants, Ks1, Ks2, Ks1s2 and Ks2s1, are denominated site binding constants since they refer to equilibria between L each specific site of R.


If you want to know more about how to get the stoichiometry (number of sites) and site binding constants with the independent sites approach you can click on the following button:


How to get the most out of biophysical techniques to address binding interactions?

The analysis of isotherms is the more direct way to calculate binding constants for molecular interactions. Isotherms can be obtained using different techniques (ITC, SPR, NMR, Uv-vis, IR, Fluorescence, Circular Dichroism…) and at different experimental conditions.

TRY AFFINImeter

1. The global fitting approach allows to simultaneously analyze several isotherms obtained by different biophysical techniques and/or at different experimental conditions in a very accurate manner.


2. Many interacting systems do not bind with a simple 1:1 model, more complex binding model can be designed to address complex interaction

3. Using tools to globally analyze isotherms obtained by different biophysical techniques is the most reliable method to characterize binding interactions by the orthogonal approach.

Click here to star using AFFINImeter and to start to create your own binding model:

TRY AFFINImeter


AFFINImeter new version!

During the last months, we’ve contacted you asking your opinion and experience with the software. Thanks for all your suggestions and needs we have improved the previous version of the software to make it easier, faster and more versatile.

What is new in this release?

  • In collaboration with Mestrelab Software, AFFINImeter can now analyze Nuclear Magnetic Resonance (NMR)  titration curves.

  • The Main toolbar has been simplified:

Data” & “Projects” have been merged into a single “Projects & Data*” menu

You can filter the elements to show by selecting “Projects & Data” (default), only “Projects” or only “Data“.

A new option has been included to easily pre-visualize the settings of your experiments directly from the list of data & projects.

The “Instruments” management menu has been removed.

*Data elements are represented by this icon –>  
*Projects elements are represented by this icon–> 


  • Now you can organize all your data and projects into folders:


  • Organize your data & projects as you would do on your computer.
  • Looking for your already existing KinITC data? Go to Projects & Data, and look into the folder “KINITC”.
  • A new parameter has been introduced to measure the quality of the FIT: Goodness of Fit

The GoF (Goodness of Fit) is the probability of finding the fitted value within a normal distribution with half-width equal to the uncertainty of each experimental point. The GoF for a curve is obtained as the mean GoF of all its points. The ideal value of perfect fit would be Gof=100%.

This parameter will be available when you execute a new FIT project/or re-execute an older project. If you visualize an already executed project, the previous parameter (χ 2) still will be present.

What have we improved from the previous version?

  • We have incorporated the possibility to perform blank subtraction right after raw data upload and processing.
  • Multiple minor usability improvements and performance tweaks.
  • Multiple bug fixes and issues suggested by our users have been implemented and resolved.


Try the new AFFINImeter here

The course of Isothermal Titration Calorimetry data analysis: second part

In the second part of this course, we are going to show you how to perform the analysis of binding isotherms considering an independent sites approach.
This approach uses a reaction scheme based on the binding of the ligand to individual sites present in the receptor and considering that all the sites are independent; thus, it supplies site binding constants.
This approach offers a sole reaction scheme where a receptor with a certain number of sites “n” binds to the ligand.
The sites are grouped into sets to discern between sites that are non-equivalent.

If you want to know more about how to get the stoichiometry (number of sites) and site binding constants with the independent sites approach you can click here:

Stoichiometric and site constants – two approaches to analyze data with AFFINImeter

The first video tutorial presented is about how to use an independent sites approach to perform fittings:

——————————————————————–

Into another subject, to introduce the second fitting approach that can be performed with AFFINImeter (Stoichiometric equilibria), we will describe how to use the model builder.
This original tool allows to design and apply your own binding model in an easy way. Check the following video to know the versatility of the model builder:

Finally, if you want to try the Model Builder click here:

Model Builder


Stoichiometric and site constants: two approaches to analyze data with AFFINImeter.

The interaction between two species, i.e. a protein and its ligand, is defined by means of the equilibria existing between free and bound species and the binding constant(s) associated to each equilibrium. This scenario can be described in terms or reaction schemes following two approaches:

a) Based on equilibria between existing stoichiometric species, to obtain stoichiometric binding constants and

b) Based on equilibria between the ligand and specific interaction site(s) of the protein, to obtain site binding constants.

affinimeter-approaches-small

The understanding of both approaches/type of binding constants is key for a correct interpretation of the results after data analysis, in order to get key structural and mechanistic information of the binding event; i.e. the presence or absence of cooperative interactions when a ligand binds to a multivalent receptor.
The design of binding models for ITC curve fitting with AFFINImeter can be done following these two approaches, to perform analysis based on stoichiometric and/or site binding constants.

The scientific team of AFFINImeter has just released three NOTES regarding this subject to guide users into the right selection of binding model approach and a better understanding of stoichiometric vs site binding constants.

Comparative table of the two approaches for binding model design available in AFFINImeter
Characteristics of the two approaches for binding model design available in AFFINImeter


DOWNLOAD PDF FILES HERE:

Or visit the RESOURCES section of AFFINImeter web page where you find tutorials, webinars, cases of use, among others.

The importance of the treatment of ITC raw data in calorimetry experiments

Isothermal titration calorimetry (ITC) is an extremely sensitive technique to assess for the formation/disruption of complex chemical/biological species in solution. During the last years, the increase in instrument sensitivity as well as the reduction of the sample concentration required to perform experiments, have made possible to expand the application range of ITC, which is expected to continue growing.

Quality of the ITC Raw Data?

The amount and the quality of useful information that can be obtained from an ITC experiment depend on several factors including the purity of the samples, the concentration of the solutions prepared, the choice of injection volume and its length in time. The researcher handling the instrument is responsible for the appropiate selection of these variables as part of the experimental setup. They can be optimized on the basis of previous experience and also taking advantage of computational simulations. A key factor for this is that ITC is an incremental technique and so the results depend strongly on the injection volume employed to perform the experiment.

Kinetic information from ITC Experiments

(more…)

20th International Symposium on Surfactants in Solution (Coimbra, Portugal)

The AFFINImeter innovation team has developed an original model to analyze dissociation ITC isotherms of aggregates ranging from (protein) dimers to large supramolecular clusters (like micelles).  With this model the average number of molecules in the aggregates, the molar free energy and enthalpy of transfer from the aggregate to the solution and the dilution of both monomers and aggregates can be obtained. This model soon will be available in the AFFINImeter Software.

The validation of this model comparing our results with those determined from other experimental methods is going to be presented in the 20th International Symposium on Surfactants in Solution (SIS, June 2014), where our CSO Angel Piñeiro is giving Oral presentation on Monday  June 23, 2014.  

How to perform a neat Isothermal Titration Calorimetry experiment?

In a Isothermal Titration Calorimetry experiment, If the injected volume or any of the concentrations is too small, or if the ratio between both concentration values is not appropriate, then the signal-to-noise ratio will be low and the uncertainty of any result will be high.

Scheme of a ITC Experiment
Isothermal Titration Calorimetry Experiment

Determinant factors of poor quality results in Isothermal Titration Calorimetry Experiments

The control of these factors might be limited by the available amount or the corresponding solutes (they can be expensive or difficult to synthesize/purify). If the total number of titrations is low then the solute in the sample cell will not be saturated and the quality of the results will be poor. Additionally, in reactions for which multiple chemical species can be formed it is always better to simultaneously fit several experimental data series, each focusing the sampling in a different concentration region which is more sensitive to any of the species.

Advantages of prior Isotherm Simulation

The simulator tool provided by AFFINImeter allows you to test the effect of the parameters listed above on your experiment in order to optimize its design, thus saving time and samples.

(more…)