Isothermal titration calorimetry (ITC) is an extremely sensitive technique to assess for the formation/disruption of complex chemical/biological species in solution. During the last years, the increase in instrument sensitivity as well as the reduction of the sample concentration required to perform experiments, have made possible to expand the application range of ITC, which is expected to continue growing.
Quality of the ITC Raw Data?
The amount and the quality of useful information that can be obtained from an ITC experiment depend on several factors including the purity of the samples, the concentration of the solutions prepared, the choice of injection volume and its length in time. The researcher handling the instrument is responsible for the appropiate selection of these variables as part of the experimental setup. They can be optimized on the basis of previous experience and also taking advantage of computational simulations. A key factor for this is that ITC is an incremental technique and so the results depend strongly on the injection volume employed to perform the experiment.
Kinetic information from ITC Experiments
There are, however, several factors that the ITC user cannot directly control since they are intrinsic to the molecular interactions to be explored, namely the exchanged energy, the kinetics of the complex formation/disruption and the probability of the interactions to be assessed. As a result of all these factors, the primary signal of an ITC experiment is a power vs time profile which typically consists of a series of positive or negative peaks followed by flatter regions. Each peak results from the energy exchanged during the injection process due to the transformation of supramolecular complexes from one to another and so, their size and shape contains information on the energy strength and on the kinetics of such transformations. In particular, it has been demonstrated that the kinetic constants corresponding to these interactions can be obtained from the shape of such peaks [1,2]. It is considered that the regions between peaks do not contain useful information on the molecular interactions that take place in the sample and they are identified as baselines. The area delimited by each peak and the interpolation between the previous and subsequent baselines determines the total amount of energy exchanged due to the transformation of chemical species during a given injection. The profile given by these areas (the integral of the peaks) as a function of the ratio between the cell concentrations of the main compound injected from the syringe (titrant) and that initially in the cell (titrate) is the signal to be analysed with thermodynamical models from which stoichiometries, enthalpies, equilibrium constants, Gibbs energies and entropies are obtained. Thus, the analysis of the power vs time profile becomes critical to get accurate thermodynamic information and even allows getting kinetic information from ITC measurements.
ITC Experimental Injection profile
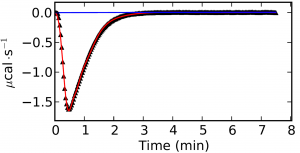
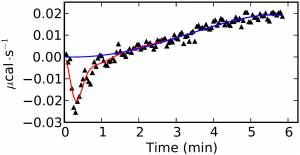
The analysis of well-behaved signals, where there is not baseline drift and the peaks are well-defined (Figure 1) is trivial but in cases where there is a drift in the signal or a high noise-to-signal ratio the analysis turns out much more complex (Figure 2). The key factors of a proper data processing are the smart detection of outliers, a good fitting of the baseline and the detection of the true end injection time. Failures in these steps are directly transmitted to the binding isotherm and then to errors in the thermodynamic characterization of the studied system. The option of manually process the ITC raw data should be available in any ITC analysis software but an efficient and smart automatic analysis is definitetly a requirement.


In AFFINImeter we have implemented KinITC, this is a new method to obtain kinetic information from Isothermal Titration Calorimetry Data. With one single titration experiment it calculates the kinetic constants (kon and koff) and the thermodynamic data (KD and ΔH) of 1:1 binding interactions.
AFFINImeter-KinITC (soon to be released) offers a general solution for the smart and efficient analysis of the primary signal obtained from ITC experiments. This solution will include an automatic detection of outliers to remove the noise, the detection of the end injection time, the integration of the injection peaks and a preliminary analysis of the peak shape during the titration. The latter feature will allow to provide an estimation of the kinetic constants in the most typical cases where the experiment involves only the formation of 1:1 complexes.
[1] kinITC: A New Method for Obtaining Joint Thermodynamic and Kinetic Data by Isothermal Titration Calorimetry. Dominique Burnouf , Eric Ennifar , Sondes Guedich , Barbara Puffer , Guillaume Hoffmann , Guillaume Bec , François Disdier , Mireille Baltzinger , and Philippe Dumas. J. Am. Chem. Soc., 2012, 134 (1), pp 559–565
[2] Soon to be released in AFFINImeter