We will be attending the European MicroCal Users’ Meeting 2015 organized by Malvern Instruments

On November 24th and 25th will be attending the  European MicroCal Users’ Meeting 2015 organized by Malvern Instruments. 

Our sales representant Dr. Juan Sabín will be there sharing ideas on new applications and challenges on Isothermal Titration Calorimetry (ITC) experiments and data analysis. We will be pleased to talkt to you. Contact us.

We are sharing the Workshop agenda publised  in the Malvern website where you will find all information of the Workshop and registration.

Free Morning Workshop
8:30 Registration and coffee
9:00 “Recent developments in interaction analysis: introducing the new MicroCal PEAQ-ITC”
Dr. Marco Marenchino, Applications Specialist, Malvern Instruments
10:30 Coffee break
11:00 “Keep your DSC at top performance: experiment design and advanced data analysis”
Dr. Marco Marenchino, Applications Specialist, Malvern Instruments
12:00 Lunch
Meeting Opens 
13:00 “Opening remarks”
Dr. Mark Wingfield, General Manager GmbH, Malvern Instruments
Plenary Lecture
13:10 “Profiling Enthalpy/Entropy to Aid Decision-Making in Drug Optimization: Fact or Fantasy?”
Prof. Gerhard Klebe, University of Marburg
Calorimetry for the studies of protein-ligand interactions in academia and DD industry
13:50 Microcalorimetry with small molecule compounds at Merck-Serono
Dr. Ansgar Wegener, Merck
14:20 “Affinity and mechanostability in protein-protein interactions”
Lukas Milles M.Sc. and Magnus Bauer M.Sc. LMU
14:50 Coffee break
15:10 “Thermodynamic landscape of the bacterial 30S translation initiation complex assembly”
Dr. Eric Ennifar, Research Director at CNRS, University of Strasbourg
15:40 The metal-dependent network for nickel delivery into urease: protein interactions and conformational changes
Dr Barbara Zambelli, University of Bologna
16:10 Drug-target interactions put under the microscope
Mrs Barbara Wienen, University of Marburg
16:40 ‘How to be PIQy’
Dr. Chris Johnson, MRC Laboratory of Molecular Biology, Cambridge
19:00 Calorimetric Dinner

November 25th

Protein and antibody characterization
08:30 “Current Applications of ITC in antibody design and development”
Christian Gassner, Roche Diagnostics
09:00 “Lessons learned from pH and excipient screening for mAb formulation development by using DSC”
Dr. Tim Menzen, Coriolis Pharma
09:30 “Accelerating biotherapeutic development”
Dr. Marco Marenchino, Application Specialist, Malvern Instruments
10:00 “DSC in formulation development of insulins”
Dr. Ursula Stock, Sanofi-Aventis
10:30 Coffee break
Data Analysis
11:00 “Complex binding models and Global Fit”
Dr. Natalia Markova, Principal Scientist – MicroCal, Malvern Instruments
11:30 “High precision ITC with automated peak-shape analysis”
Prof. Dr. Sandro Keller, Molecular Biophysics, University of Kaiserslautern,Germany
12:00 Lunch
Novel Applications I
13:00 “Microcalorimetric studies of lipid and detergent systems”
Prof. Dr. Heiko Heerklotz, Professor for Pharmaceutics, University of Freiburg
13:30 “Enzymatic conversion of biomass: A calorimetric approach”
Prof. Dr. Peter Westh, Professor of Biophysical Chemistry, Roskilde University
14:00 “Nanotools to understand when a protein can induce an immune response”
Dr. Mihaela Delcea, Group Leader Nanostructure, University of Greifswald
14:30 Coffee break
Novel Application II
15:20 Calorimetric studies of supramolecular peptide assembly and protein aggregation
Prof Büll, University of Düsseldorf
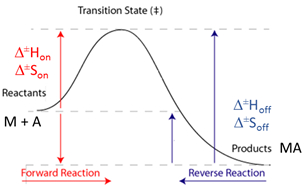
15:50 “KinITC: Get more out of ITC data”
Dr. Eric Ennifar, Research Director at CNRS, University of Strasbourg
16:20 “Concluding remarks”
Dr. Mark Wingfield, General Manager GmbH, Malvern Instruments

Global parameters and reaction parameteres

Global parameters

Fitting parameters accounting for experimental artifacts that have an effect on the ITC isotherm

Qdil: corrects for the molar enthalpy of dilution of the injected solute, this is generally required when no complementary dilution experiment (with the pure solvent in the cell) were performed and subtracted from a binding experiment

Qdb: corrects for a potential baseline shift, generally due to external (not specific from the studied system) physical phenomena

r(M), r(A), r(B): scaling parameters empllyed to correct potential differences between nominal and true concentration of compounds M, A and B, respectively. The “r” parameter multiplied by the nominal concentration yields the true concentration (i.e. r(A)=0.9 indicates that the real concentration of the main compound in the sample cell “A” is 0.9 times the nominal concentration).

Value/eq: initial guess or “seed” value. This field can be left as random (RND), it can be filled with a number or, with an equation that relates it to another parameter of the fit subproject.

Min-Max: set the upper and lower limits of the fitting parameter.

Fit: check this option for a particular parameter if you want to fit it during the analysis. Uncheck it if you want to set the parameter as a constant value (specified in the value/eq field).


Reaction parameters

Fitting parameters of the thermodynamic data associated with the equilibria described in the binding model selected.

Ka: Association constant

ΔH: Binding enthalpy

Value/eq: initial guess or “seed” value. This field can be left as random (RND), it can be filled with a number or, with an equation that relates it to another parameter of the fit subproject.

Min-Max: set the upper and lower limits of the fitting parameter.

Fit: check this option for a particular parameter if you want to fit it during the analysis. Uncheck it if you want to set the parameter as a constant value (specified in the value/eq field).

Analysis of Variable Temperature ITC experiments: Temperature dependence of DH, Van’t Hoff’s and Eyring’s Plots

Information: Temperature dependence of ΔH

ΔH is a simple linear function of temperature, and the change in heat capacity, ΔCp, can be determined as the slope of a plot of ΔH values measured at different temperatures:

ΔH = ΔCp·T + ΔHTref

Where:

  • ΔH = Change in enthalpy between reactants and products* at temperature T
  • ΔHTref = Change in enthalpy at the reference temperature, Tref.
  • ΔCp = Change in heat capacity between reactants and products
  • Tref = Experimentl temperature closest to the average of all temperatures used.

Plot of ΔH vs T yields ΔCp (slope) and ΔHTref

* Note: For a binding equilibrium the reactants are the free species (i.e ligand and receptor) and the products are the complex(es) formed.


Information: Van’t Hoff plot

The Van’t Hoff equation is widely used to estimate the change in enthalpy, ΔH, and entropy, ΔS, between reactants and products* by measuring the equilibrium constant, KA, at different temperatures. The linear form of the Van’t Hoff equation is as follows:

Ln(KA)= −ΔH/RT + ΔS/R


Where T is the temperature (in kelvins) and R is the universal gas constant. This equiation assumes a linear relationship between Ln(KA) and 1/T and it applies when the change in heat capacity between reactants and products, ΔCp, is negligible.

The Van’t Hoff plot is the graph resulting of Ln(KA) plotted against 1/T. Knowing the slope and the intercept from this plot the values of ΔH and ΔS are determined as follows:

ΔH = −R·slope

ΔS = R·intercept


* Note: For a binding equilibrium the reactants are the free species (i.e ligand and receptor) and the products are the complex(es) formed.


Information: Eyring plot

The Eyring equation describes the relationship between reaction rates (konand koff) and temperature and it is used to determine enthalpy and entropy of activation, ΔH‡ and ΔS‡, respectively. The linear form of the Eyring equation is as follows:

Ln(k/T)= −ΔH‡/RT + Ln(kB/h) + ΔS‡/R


Where k is the rate constant (kon or koff), T is the temperature (in kelvins), R is the universal gas constant, kB is the Boltzmann’s constant, h is the Planck’s constant, ΔH‡ is the enthalpy of activation and ΔS‡ is the entropy of activation.


The Eyring plot is the graph resulting of Ln(k/T) plotted against 1/T. Knowing the slope and the intercept from this plot, the values of ΔH‡ and ΔS‡ are determined as follows:

ΔH‡ = −R·slope

ΔS‡ = R·(intercept − Ln(kB/h))

When kon is used in the Eyring plot, ΔH‡ and ΔS‡ correspond to the enthalpy and entropy of activation from the reactants up to the transition state. Similarly, when koff is used in the Eyring plot, ΔH‡ and ΔS‡ correspond to the enthalpy and entropy of activation from the products up to the transition state


The Eyring plot.
The Eyring plot is the graph resulting of Ln(k/T) plotted against 1/T.

Extending ITC to Kinetics with kinITC


Title: Extending ITC to Kinetics with kinITC

Authors: Philippe Dumas, Eric Ennifar, Cyrielle Da Veiga, Guillaume Bec, William Palau, Carmelo Di Primo, Angel Piñeiro, Juan Sabín, Eva Muñoz, Javier Rial.

Abstract:

Isothermal titration calorimetry (ITC) has long been used for kinetic studies in chemistry, but this remained confined to enzymatic studies in the biological field. In fact, the biological community has long had the tendency of ignoring the kinetic possibilities of ITC considering it solely as a thermodynamic technique, whereas surface plasmon resonance is seen as the kinetic technique par excellence. However, the primary signal recorded by ITC is a heat power which is directly related to the kinetics of the reaction. Here, it is shown how this kinetic signal can be recovered by using kinITC, the kinetic extension of ITC. The theoretical basis of kinITC is detailed for the most common situation of a second-order reaction A + B Ω C characterized by kinetic parameters kon,koff. A simplified kinITCETC method based upon the determination of an “Equilibration Time Curve” (ETC) is presented. The ETC is obtained by automatic determination of the “effective end” of each injection. The method is illustrated with experimental results with a comparison to Surface Plasmon Resonance (SPR) data. kon values were obtained in a wide range, from 103 to 0.5 × 106 M− 1 s− 1. All procedures were implemented in the program AFFINImeter (https://www.affinimeter.com/).

Get full Publication here.

KinITC Logo
KinITC


Treat, No Tricks! 10 hours of ITC data analysis consulting for Free

Treat, no Tricks!

As a launching promotion 10 FREE hrs of data analysis consulting are included into your advanced plan. 

  • This advanced plan includes unlimited technical support relative to the use of AFFINImeter.
  • 10 hours of data analysis consulting  relative to your particular interaction system and data. Each hr is valuated in 120€ and during this launching promotion these are for free.
  • Remember that the current Free trial promotion includes 2 hrs data analysis consulting.


KinITC: Obtain Thermodynamic and Kinetic Data from your ITC Measurements in just five clicks

In AFFINImeter we have implemented KinITC, this is a new method to obtain kinetic information from Isothermal Titration Calorimetry Data. With one single titration experiment it calculates the kinetic constants (kon and koff) and the thermodynamic data (KD and ΔH) of 1:1 binding interactions.

Global fitting: the key for a robust analysis

The Indian parable of “the six blind men and the elephant” tells the story of six blind men who touch an elephant in the hope of learning what it is like. As each one can only feel a different part of the animal the individual conclusions obtained are in disagreement and none of them provides a real view of the full elephant. “only by sharing what each of you knows can you possibly reach a true understanding”; that´s the moral behind this nice story.

The six blind men and the elephant: only a global analysis of the overall data provides a true understanding

Sometimes, when we perform two or more ITC titration experiments of a complex interacting system under different experimental conditions (i.e. different concentrations and/or experimental setup) we find out that the individual analysis of the corresponding isotherms yields different values of the thermodynamic parameters. This result can be very confusing, especially for newcomers in the field of molecular recognition, because all these experiments are a representation of the same interaction and should converge to provide the same information. Frequently, the explanation for this behaviour is that each individual ITC experiment lacks of sufficient information to unequivocally determine the thermodynamic parameters of the binding event. “It´s like feeling only a separate part of the elephant”.
Analogous to the parable of the six men and the elephant, the way to get a true understanding of the binding event consist of the global analysis of the different isotherms.
Being aware of the relevance of global analysis, in AFFINImeter we count with the possibility to perform Global fitting of multiple dataseries (isotherms) to tailored binding models where one or more fitting parameters are shared between isotherms. The number and identity of the parameters shared are selected by the user. Moreover, two or more parameters can be related trough mathematical relationships designed by the user. All these features make our global fitting tool the most potent among others to perform a robust analysis of ITC data of complex interactions.

Learn how to perform a global analysis with AFFINImeter:

AFFINImeter and Isothermal Titration Calorimetry

AFFINImeter and Isothermal Titration Calorimetry: A perfect match for the complete Thermodynamic and Kinetic Characterization of molecular interactions

  1. Get thermodynamic and Kinetic profiles of your interaction in a few clicks.
  2. Get structural and mechanistic information of complex interacting systems.
  3. Quick access to Data Interpretation Tools.

Have a look at poster of AFFINImeter presented at the NovAlix conference last week, which describes the main features of AFFINImeter with illustrative examples. Many researchers put special attention to the fast and efficient way of processing raw ITC data to get, in just 5 clicks, thermodynamic and kinetic information. Check the video below for a quick demo of this awesome tool!


Get the kinetic parameters from standard ITC experiments in 5 clicks.

AFFINImeter & Isothermal Titration Calorimetry from AFFINImeter

AFFINImeter Publications


During the last months we’ve been developing software and providing  support to PhD studends, Postdocs, GroupFacilities and Principal Investigators . Nowdays our  products are being used  by more than 500 research laboratories from 43 countries around the globe.  AFFINImeter is the only software that provides thermodynamic and kinetic information from a single ITC titration; now incorporates the automatic analysis of variable-temperature experiments.  AFFINImeter can handle Isothermal Titration Calorimetry data obtained from the Microcal (Malvern) and TA Instruments calorimeters and provides the most complete analysis of ITC data.

Here are some scientific publications obtained with AFFINImeter software

Take your research further with AFFINImeter
AFFINImeter: Simulation, advanced Data fitting and kinITC analysis.

AFFINImeter at the NovAliX Conference 2015

NovAliX Conference 2015

novalix-conference-2015-strasbourg-banner

AFFINImeter will be at the 2nd NovAliX conference that will be held next June, days 9-12, in Strasbourg, France.

Our Scientific team will present the poster

AFFINImeter & ITC: A PERFECT MATCH FOR THE COMPLETE THERMODYNAMIC AND KINETIC CHARACTERIZATION OF MOLECULAR INTERACTIONS:

The use of Biophysical methods for the characterization of molecular interactions has become a fundamental milestone in the area of pharmaceutical research. Into this subject, Isothermal Titration Calorimetry, ITC, is considered the gold standard for the thermodynamic characterization of molecular interactions, but with a potential that has not been fully exploited yet.

(more…)