New agreement: Mestrelab Research & AFFINImeter

Mestrelab Research and Software 4 Science Developments-AFFINImeter have agreed to enhance the use of advanced analysis of binding isotherms from 2D-NMR titrations. For this reason, all users interested to acquire a Mnova Binding license will benefit from a free annual license of AFFINImeter- NMR.

Mnova Binding is a powerful tool that automatically processes 2D HSQC type of protein-ligand titration spectra, tracks the peak movement and computes the Kd‘s for multiple peaks.

AFFINImeter for Nuclear Magnetic Resonance allows the advanced analysis of binding isotherms from 2D NMR titrations to measure binding constants (KA). Use it to:

  • Simultaneous upload and processing of 2D titration spectra.
  • Automated peak tracking of stacked spectra.
  • Automated generation of binding curves.
  • Easy exporting of binding curves into AFFINImeter-NMR.

More info here: Start using AFFINImeter-NMR


Open position: Chief Operating & Financial Officer (COFO)

Founded in 2013, Software 4 Science Developments (S4SD) is a leading cloud computing service provider of scientific software AFFINImeter, with more than 1.000 users including the biggest pharmaceutical corporations and research centres and Universities. The company is headquartered in Santiago de Compostela.

We are looking for a COFO to manage the planning and business functions, as well as the overall operations of the company. In addition to general responsibility for financial planning and controls, personnel administration, systems and physical facilities, the COFO should plan for the changing needs of the organization, share responsibility for strategic planning, practice management, and marketing, and contribute to aligning organizational structure with strategy. The COFO will lead and direct the operational and administrative functions of the firm, including accounting and finance, human resources, facilities, conflicts, and records management. This person will be a member of the firm’s Executive Committee.

The COFO supports the CEO in:

  • Matters of strategy and business development, coordinating the different areas of the company.
  • Providing strategic support through facilitating or advising strategy development while demonstrating foresight, conceptual capability and environmental market awareness. The COFO should manage the leads acquisition and integration for short and long-term strategy development.
  • Development and management of transverse projects of transformation (digital, organization and processes), ensuring the constant simplification and growth of the business. Management of internal communication related to the transformation activities.
  • Managing the corporate agenda, including the various internal/external committees and boards.
  • Constant relation to Shareholders & Senior Management.

The COFO is responsible for:

  • Finding public and private sources of funding.
  • Financial Management: Including planning, forecasting, budgeting, variance analysis, profitability analysis, financial reporting, general ledger accounting, billing, cash flow control, banking relationships, tax planning, tax reporting, trust accounting, payroll, and other financial management functions.
  • Human Resource Management: Including recruiting, selection, training and development, performance evaluation, budgeting and salary administration, employee relations, benefits administration, workers’ compensation, job design and other human resource management functions.
  • Systems Management: Participation in the design and implementation of a KPI information system for all areas of the company, operational audits, cost/benefit analysis, information services, document management systems and procedures, information storage and retrieval, litigation support, and other systems management functions.

Required skills:

  • Bachelor’s degree and preferably an MBA
  • 8+ years of experience, 3+ in a senior position as a Chief Operational Officer and/or Chief Financial Officer, preferably in software companies and/or startup environments.
  • Competencies skills: Used to working in international environments. Results-oriented, strategic thinker and planner. Teamwork. Communication and interpersonal skills. Synthesis and presentation skills. Time management and ability to prioritize. Hands-on proactive attitude. Analytical. Creativity. Proficiency in English / Native Spanish

We offer:

  • Salary: based on interview, bonuses
  • Real ownership and results
  • And a competitive, friendly, international team!

Please contact to staff@affinimeter.com

Global fitting: the key for a robust analysis

Download use case: Global Fitting


The Indian parable of “The six blind men and the elephant” tells the story of six blind men who touch an elephant in the hope of learning what it is like. As each one can only feel a different part of the animal the individual conclusions obtained are in disagreement and none of them provides a real view of the full elephant. “only by sharing what each of you knows can you possibly reach a true understanding”; that´s the moral behind this nice story.


Fig 1: The six blind men and the elephant: only a global analysis of the overall data provides a true understanding.

The binding assay(s) achieved to characterize a molecular interaction often provides not just one, but several binding curves from which the affinity constant is obtained.
Sometimes, an individual fit of these curves yield a set of binding constants that are significantly different from them; this result can be very confusing because, in principle, these binding curves are a representation of the same binding event and should converge to provide the analogous information. Often, the explanation for this behaviour is that the different curves indeed provide only partial and/or different information of the interaction, not enough to unequivocally determine the binding affinity through individual analysis.


“It´s like feeling only a separate part of the elephant”


This is a typical scenario when facing the study of complex binding events that involve more than one equilibrium and several binding curves are obtained, i.e. from different frequencies of the spectra in a titration experiment, from data registered using different techniques (ITC, NMR, Optical Spectroscopies…) and/or from experiments performed at different concentrations of the species participating in the binding event.


Analogous to the parable of the six men and the elephant, the way to get a true understanding of the binding event consist of the global analysis of the different curves.

Fig 2: The binding curve obtained from 2D NMR titrations.


Being aware of the relevance of global analysis, in AFFINImeter we count with the possibility to perform Global fitting of multiple data to tailored binding models where one or more fitting parameters are shared between isotherms. The number and identity of the parameters shared are selected by the user.
Moreover, two or more parameters can be related through mathematical relationships designed by the user. All these features make our global fitting tool the most potent among others to perform a robust analysis of binding data of complex interactions.

About the disuses of  Isothermal Titration Calorimetry in drug discovery research

Isothermal Titration Calorimetry (ITC) is the gold standard for the calculation of affinity in molecular interactions. Many times, researchers claim that the high consumption of sample does not offset the use of ITC for Kd calculation.
Conversely, ITC hides many surprises in the acquisition data that can provide more information in a single experiment that other techniques that are more expensive and more complicated to use.

Download the PDF file of Implementation of kinITC into AFFINImeter


1. ITC collects data from the interaction as a function of time that can be analyzed to obtain kinetic information (kon and koff values). It can cover a very similar range as Surface Plasmon Resonance in a “label-free” and “in-solution” manner (Fig 1).

2. ITC can also provide valuable information about the mechanism of interaction. The high sensitivity of the ITC sensor makes it sensitive to more intriguing interactions as conformational changes, cooperativity…

Using a global fitting approach for the analysis of the isotherms and a model builder to create tailored binding models, the different mechanisms of interaction can be confirmed and characterized.

Find attached a couple of publications describing the application of this new method for ITC data analysis:

Download the PDF file of Implementation of kinITC into AFFINImeter


The concepts of stoichiometric and site binding constants

Download: The concepts of stoichiometric and site binding constants

The interaction between a monovalent ligand L and a multivalent receptor R involves the presence of various species, including the complex of R fully saturated with a number of ligands, and intermediate complexes of R partially saturated. This scenario can be described in terms of reaction schemes following two approaches:


  1. Based on equilibria between existing stoichiometric species (Stoichiometric approach).
  2. Based on equilibria between L and specific interaction sites of R (independent sites approach).
For a better understanding, let´s consider a particular case where L binds to a bivalent receptor:

1. Stoichiometric approach

This approach uses reaction schemes based on equilibria between stoichiometric species and yields stoichiometric binding constants. A model based on stoichiometric equilibria is valid to fit data of both independent and non-independent events and therefore, it is of wider applicability.

Here, the reaction scheme includes a first equilibrium between the free species and the intermediate RL and the second equilibrium between RL + L and RL2 (Fig. 1). The corresponding binding constants, K1 and K2, are denominated stoichiometric binding constants since they refer to equilibria between stoichiometric species.


2. Independent site approach

This approach uses a reaction scheme based on the binding of the ligand to individual sites present in the receptor and considering that all the sites are independent; thus, it supplies site binding constants.

In this case, the reaction scheme considers the presence of two sites in the bivalent receptor and two intermediate complexes (R, L and RL) formed when the ligand binds to s1 or s2 and consequently, the existence of a total of 4 equilibria (Fig. 2). The corresponding binding constants, Ks1, Ks2, Ks1s2 and Ks2s1, are denominated site binding constants since they refer to equilibria between L each specific site of R.


If you want to know more about how to get the stoichiometry (number of sites) and site binding constants with the independent sites approach you can click on the following button:


How to get the most out of biophysical techniques to address binding interactions?

The analysis of isotherms is the more direct way to calculate binding constants for molecular interactions. Isotherms can be obtained using different techniques (ITC, SPR, NMR, Uv-vis, IR, Fluorescence, Circular Dichroism…) and at different experimental conditions.

TRY AFFINImeter

1. The global fitting approach allows to simultaneously analyze several isotherms obtained by different biophysical techniques and/or at different experimental conditions in a very accurate manner.


2. Many interacting systems do not bind with a simple 1:1 model, more complex binding model can be designed to address complex interaction

3. Using tools to globally analyze isotherms obtained by different biophysical techniques is the most reliable method to characterize binding interactions by the orthogonal approach.

Click here to star using AFFINImeter and to start to create your own binding model:

TRY AFFINImeter


AFFINImeter binding models for Nuclear Magnetic Resonance

AFFINImeter is already well known in ITC binding data analysis for providing the possibility to use tailored binding models created by the user. The models are generated with the tool “model builder” that includes a letter code “M-A-B” to describe titrate (M), titrant (A) and if necessary, the presence of a third species (B) (Figure 1).


Fig.1 Example of a competitive binding model created in AFFINImeter where the titrant in syringe “A” binds to the titrate in cell “M” to form a 1:1 complex “MA” and a second ligand “B” mixed in the cell with “M” forms the complex “MB” and thus competes with “A”.


Following the same approach, the binding models available for the software AFFINImeter for Nuclear Magnetic Resonance are generated with the model builder and based on the “MAB” code. But there are significant differences between ITC and NMR data analysis when the time comes to select a binding model from AFFINImeter, which have an origin in the inherent characteristics of each technique and in the different experimental design. In chemical shift perturbation (CSP) NMR titration experiments, the observed parameter used to monitor the progress of the binding event is the chemical shift of titrate resonance signals. Hence, the models used for NMR data analysis require the presence of compound “M” (titrate) as it is the species from which changes associated with the binding process are monitored. Conversely, in ITC the observed parameter is the heat change upon interaction and this parameter is not necessarily linked to a particular species “M”, “A” or “B”.

An illustrative example is the evaluation of a monomer-dimer self-association process using NMR or ITC. In NMR, the standard experimental setup would consist in the incremental dilution of the compound sample at high concentration in the NMR tube, to monitor dimer dissociation (Figure 2a). In ITC the standard experimental setup would consist in a titration of the compound sample at high concentration in the syringe (species “A” according to the AFFINImeter code) into the calorimetric cell filled up with solvent (Figure 2b).


Fig.2 Representation of experimental setup for a) NMR dilution experiment and b) ITC dilution experiments. The corresponding schemes of AFFINImeter binding models for data analysis are shown.


Would you like to know more about AFFINImeter for Nuclear Magnetic Resonance? Press the button below:

AFFINImeter-NMR


Pursuing a reliable calculation of binding affinity.

The relevance of uncertainties.


The reliable determination of binding constants (Ka) and enthalpies (ΔH) from Isothermal Titration Calorimetry depends, among other aspects, on the quality of the thermogram recorded where a high signal-to-noise ratio is pursued to get a trusty isotherm. Low signal-to-noise ratio conducts to less precise integration of the thermogram peaks and, consequently, to a binding isotherm defined by points with larger related uncertainties. Logically, the uncertainty associated to the integral points will significantly affect the determination of the thermodynamic parameters and should not be set aside through the data analysis.

Here´s an illustrative example of two ITC experiments of the interaction between Carbonic Anhydrase II (CA) and 4-carboxybenzenesulfonamide (4-CBS) that yielded thermograms of different quality (Fig 1*).

Fig.1 ITC titrations of 4-CBS into CA. a) Exp1, higher signal-to-noise ratio; b) Exp2, lower signal-to-noise ratio.

Data fitting to a 1:1 binding model was performed for both experiments and for comparison purposes the analyses were conducted twice, taking into account the uncertainties associated to the calculation of the peaks integral (weighted fitting) and not considering them (all the points having the same weight).
The results show a larger discrepancy in the Ka values obtained from Exp2, depending on whether or not the uncertainties are included in the fitting. Besides, the Ka obtained from the weighted fitting of Exp2 is significantly closer to the corresponding Ka value of the weighted fitting of Exp1 (Figure 2).
Fig.2 KA, DH and rM (correction parameter for CA concentration in the cell) values from fitting of Exp1 and Exp2 a) without uncertainties and b) with uncertainties. The bar diagrams show the comparison between KA values of Exp1 and Exp2.


The main origin of this difference is the large uncertainty associated to the mid-titration point, which consideration has an effect on the final Ka value (Figure 3).
Fig.3 Fitted isotherm from Exp 2. Redline: theoretical curve calculated when considering uncertainties; black line: theoretical curve calculated with no uncertainties.


Being aware of the relevance of weighting data points based on their uncertainty AFFINImeter includes, into the raw data processing step, the automatic determination of uncertainties in the peaks integration and the possibility to perform weighted fitting for a more reliable analysis. Another good reason to work with AFFINImeter!


Why is such a good idea to perform global fitting even for 1:1 interactions?

Advantages of performing a global fitting of several Isothermal Titration Calorimetry isotherms

We have remarked the relevance of global fitting as an indispensable tool to perform a robust analysis of complex binding interactions. Actually, global fitting is a very advantageous tool for the analysis of simpler binding modes like standard 1:1 interactions and it can be used to identify the source of potential differences observed between experiment repeats.
Here we will see how to use global fitting together with the parameters rA and rM of AFFINImeter to identify the source of discrepancies between repeats of the same experiment, to ultimately end up with reliable results.
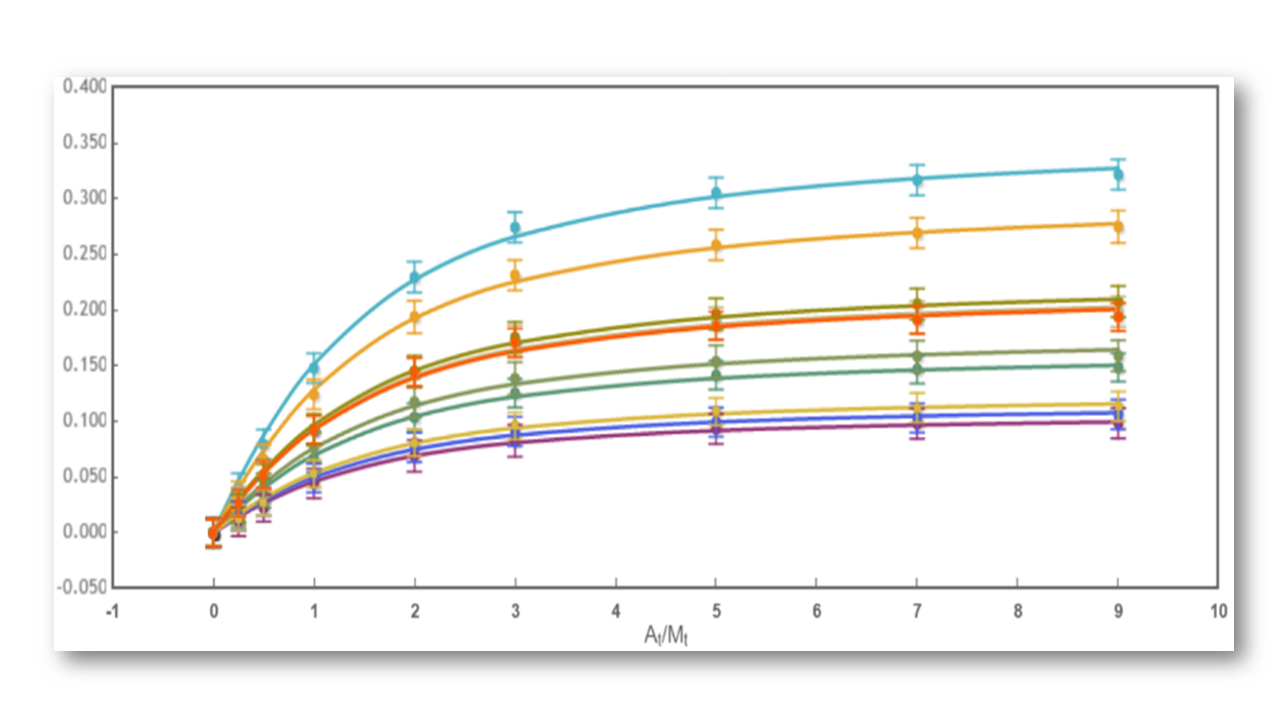
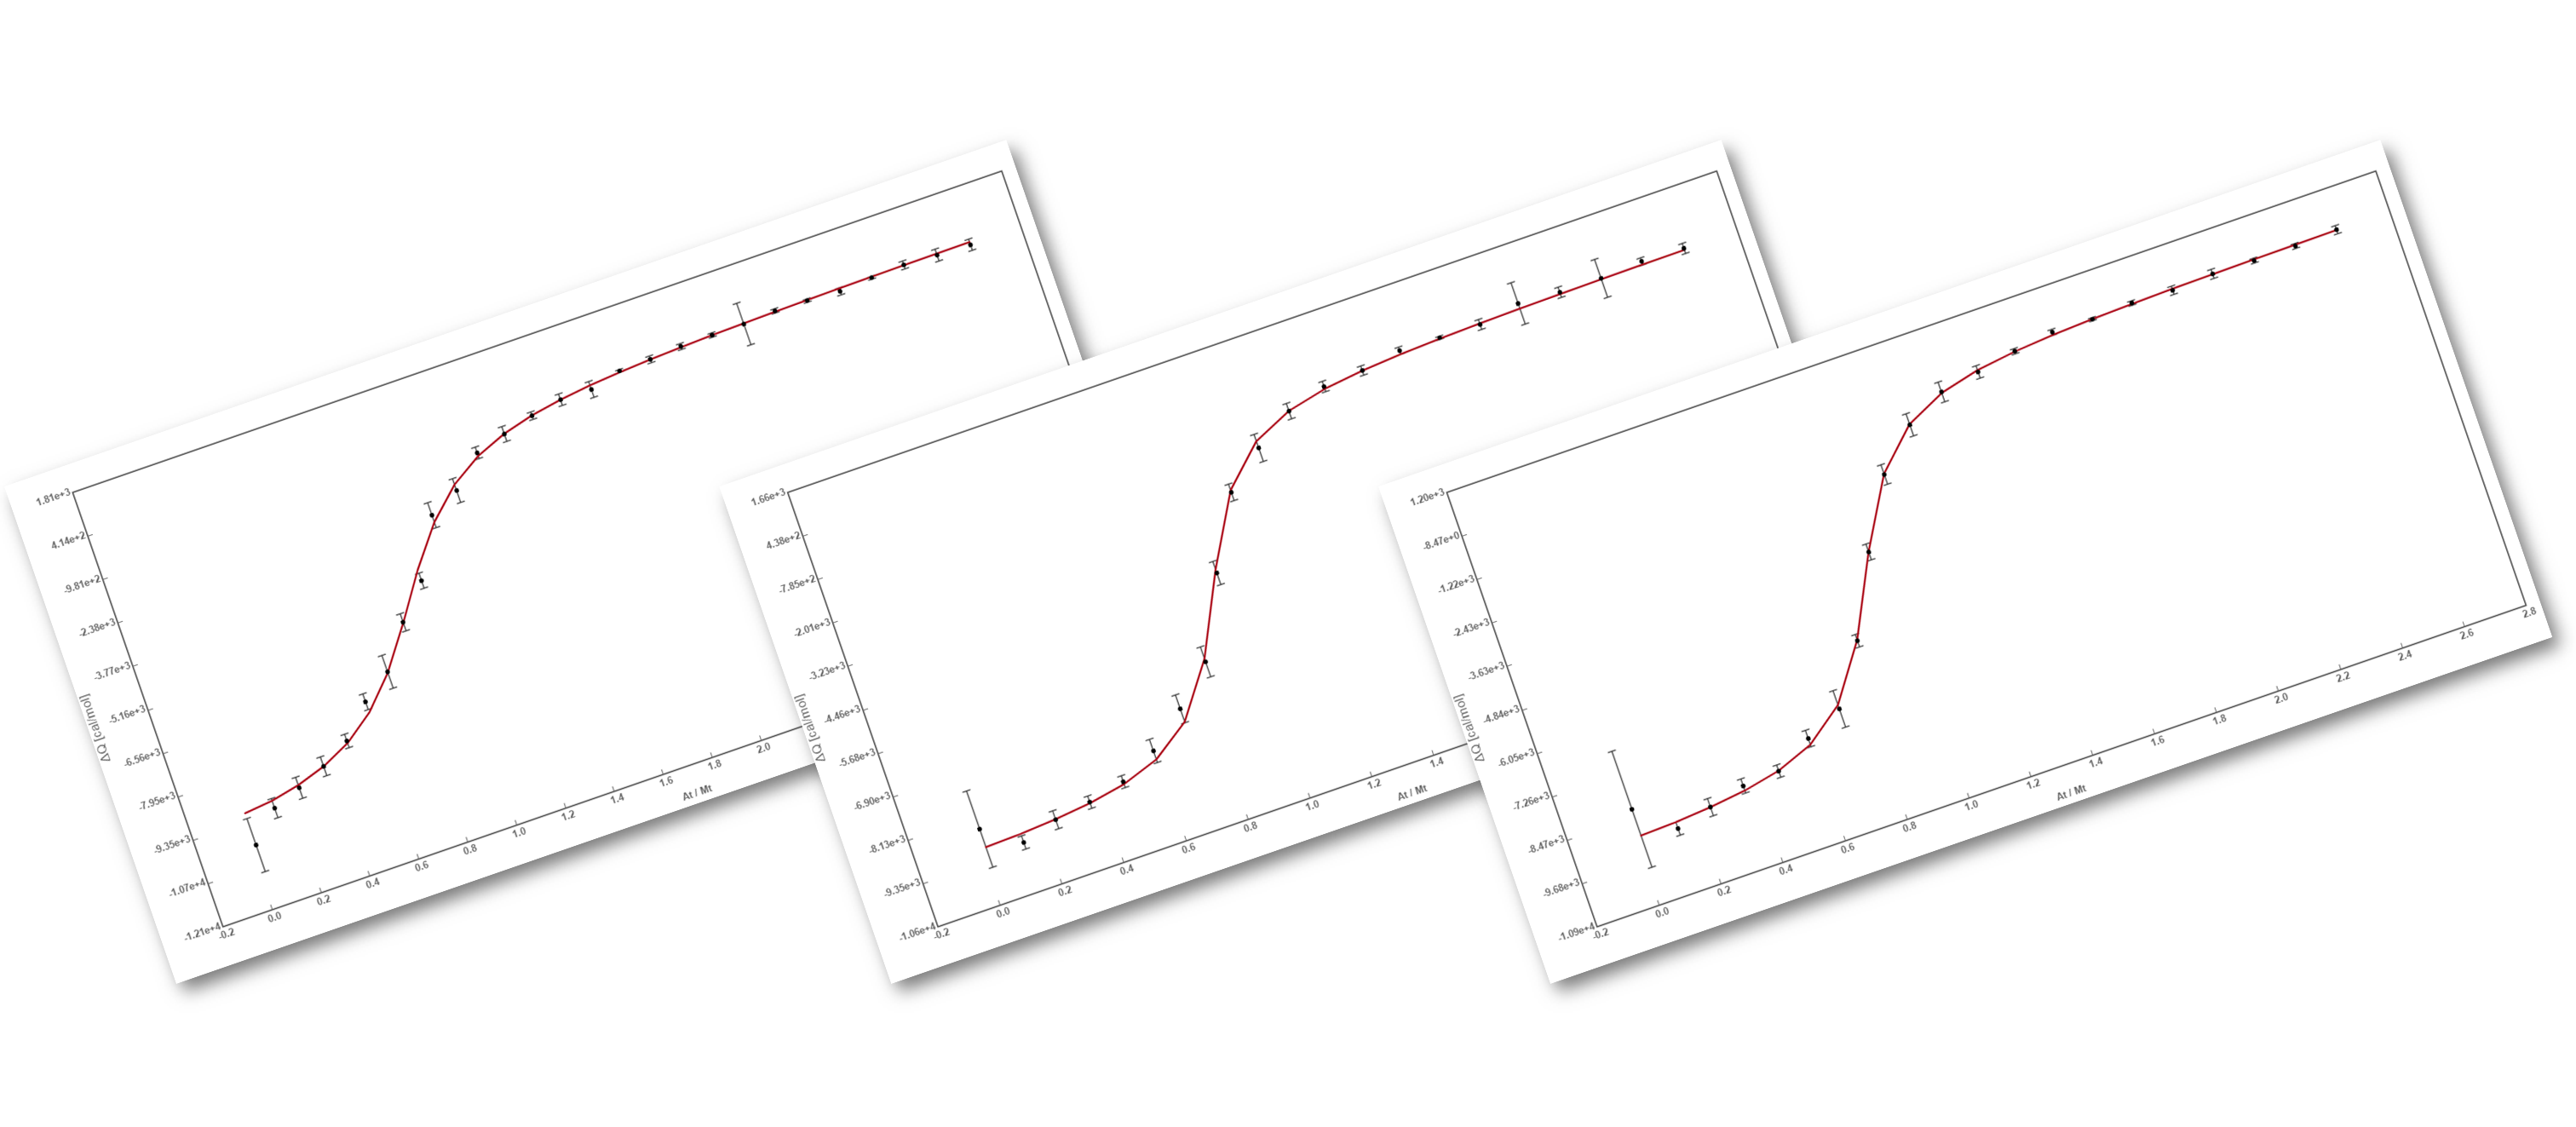
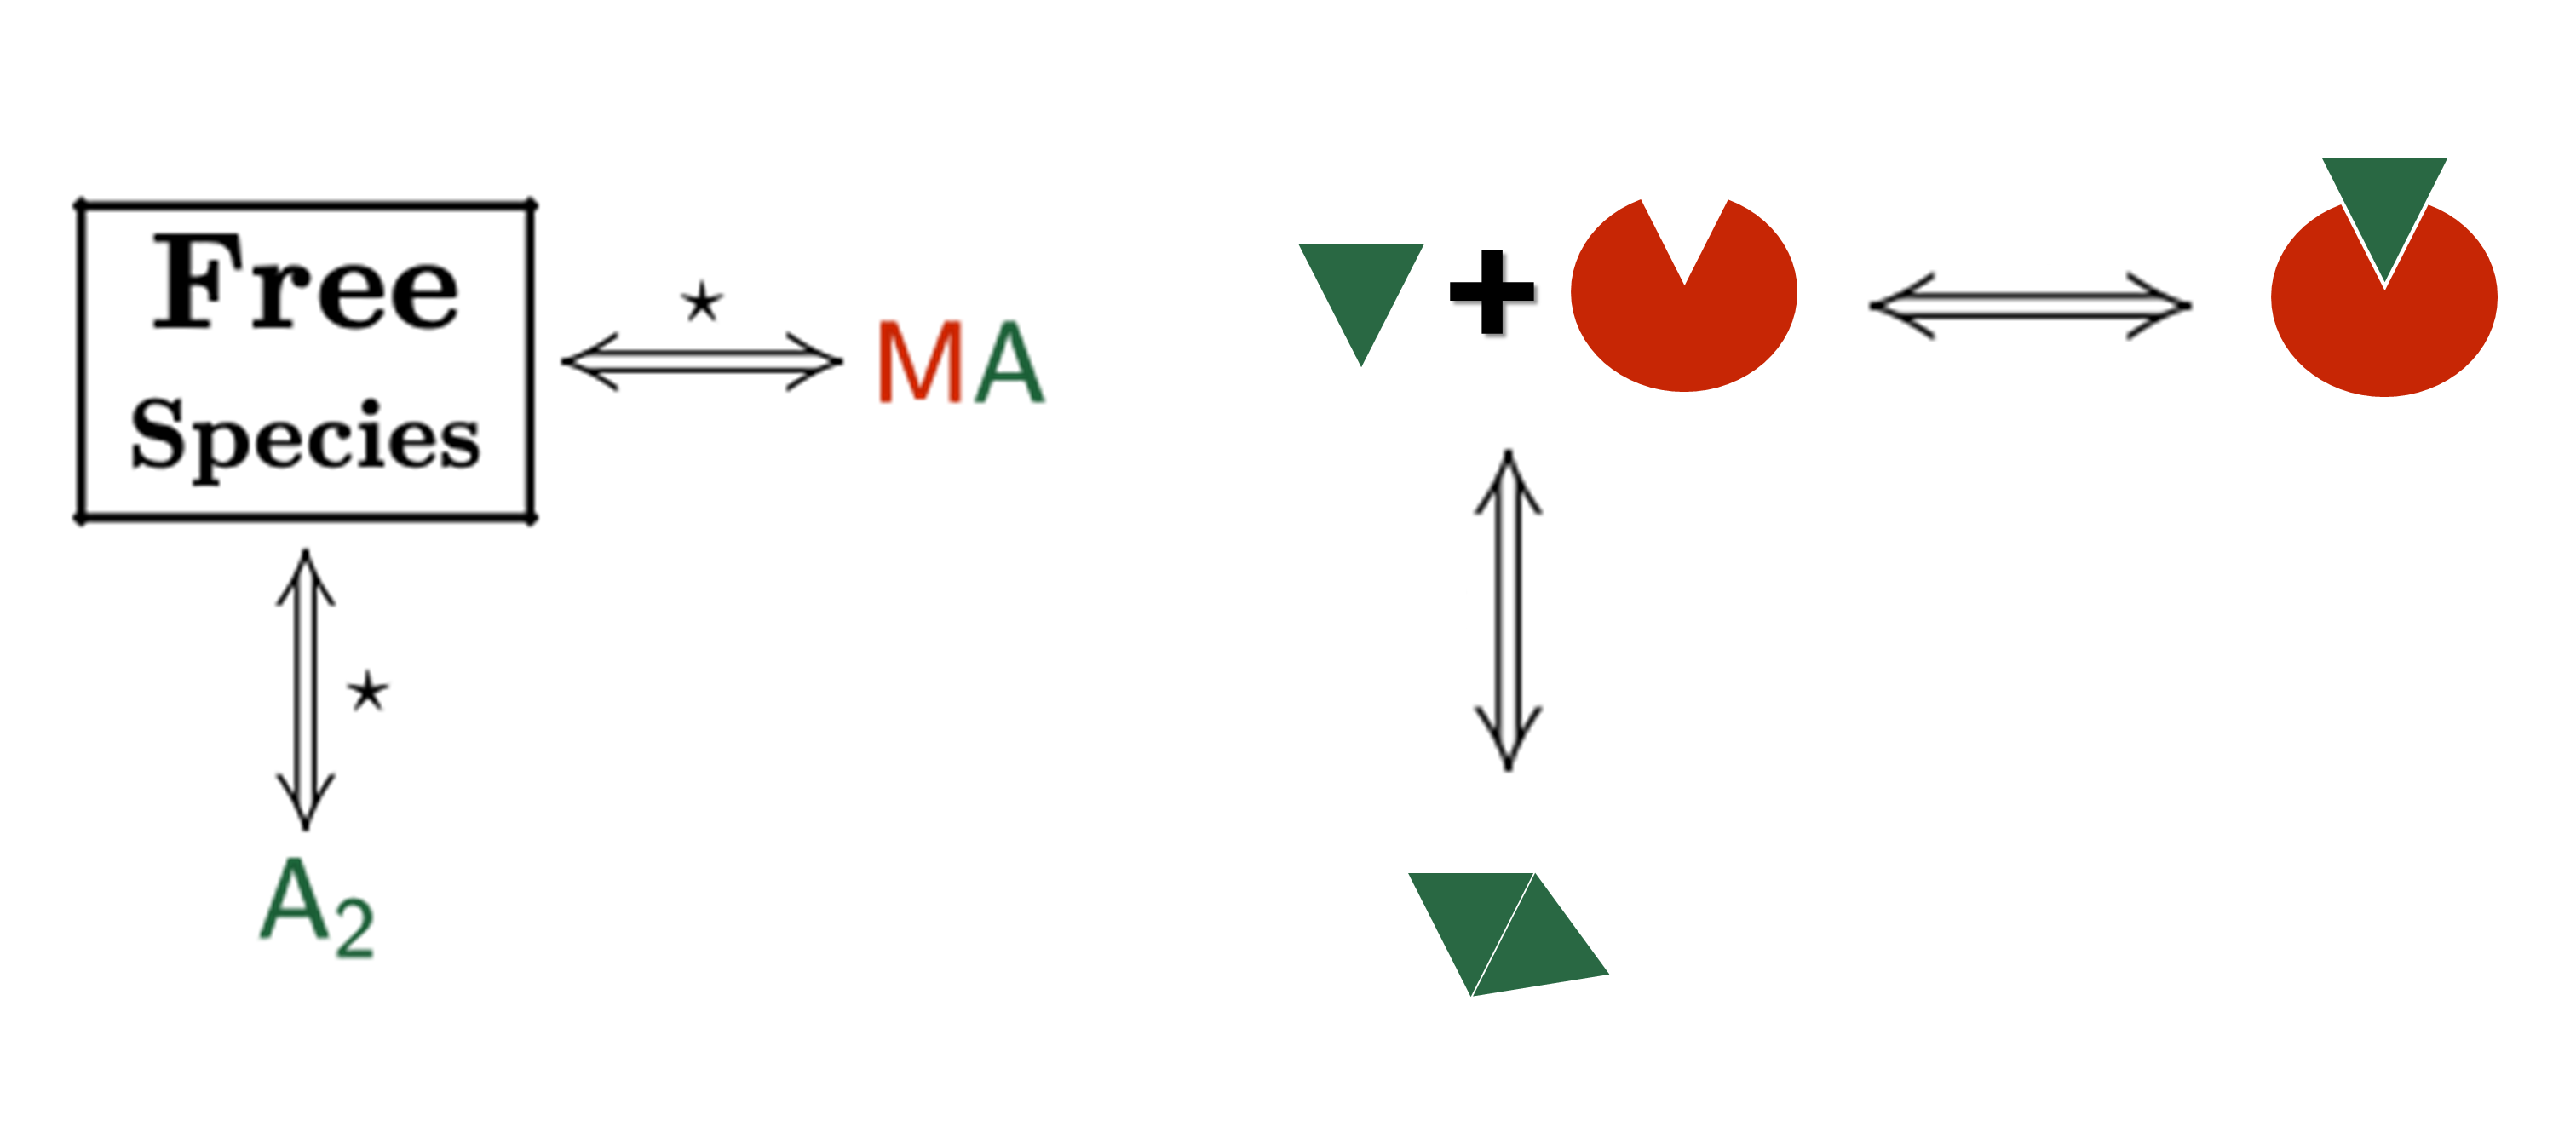
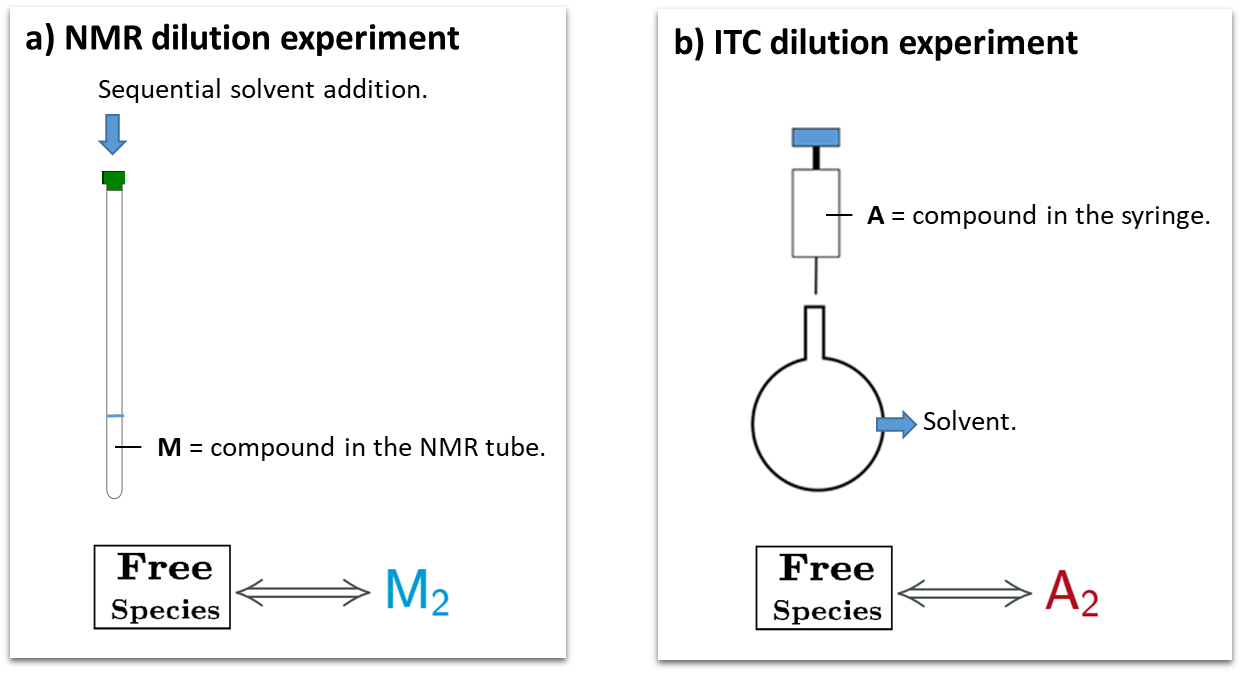
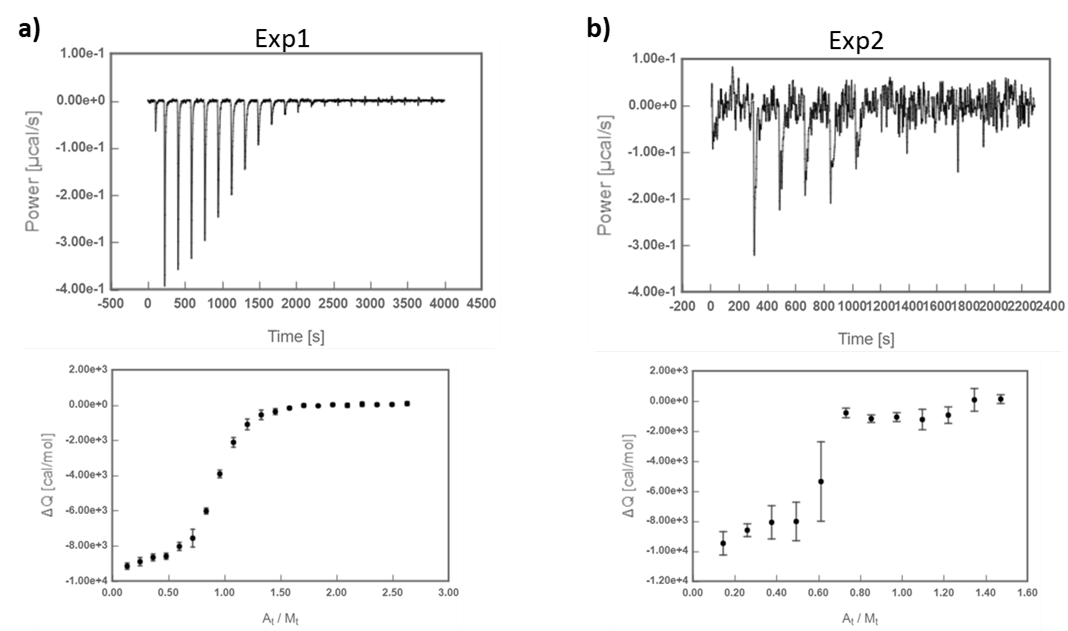
The isotherms of figure 1 are replicates of the same ITC experiment where a 1:1 interaction between the titrant (A) and the titrate (M) is monitored, but individual fitting of each isotherm to the simple model M + A ↔ MA (Figure 2) yield different KA (association constant) and ΔH values. In fact, from a visual inspection of the isotherms one can presume that  the saturation degree reached in replicate 1 is less than in replicate 2 and that the mid titration point is below the expected stoichiometric equivalence point (At/M= 1), most probably because the titrant (A) and/or titrate (M) concentration was not accurately determined in this experiment.
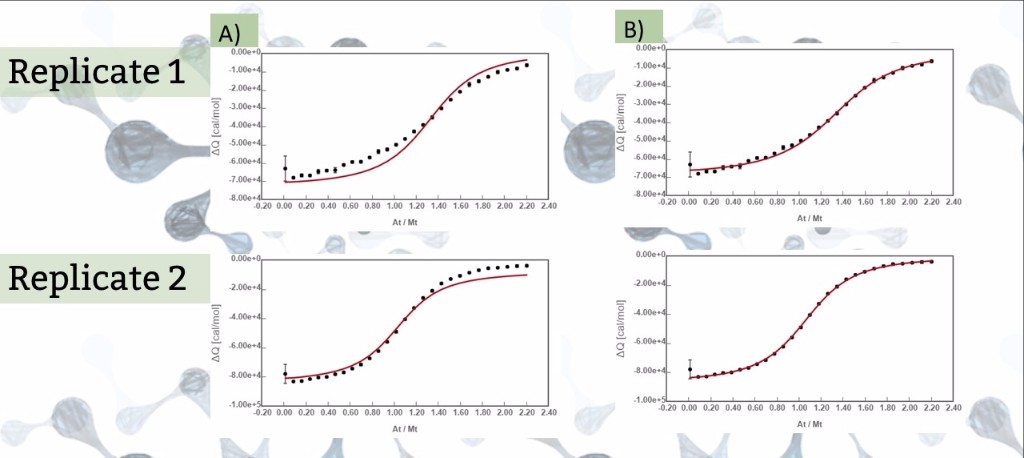
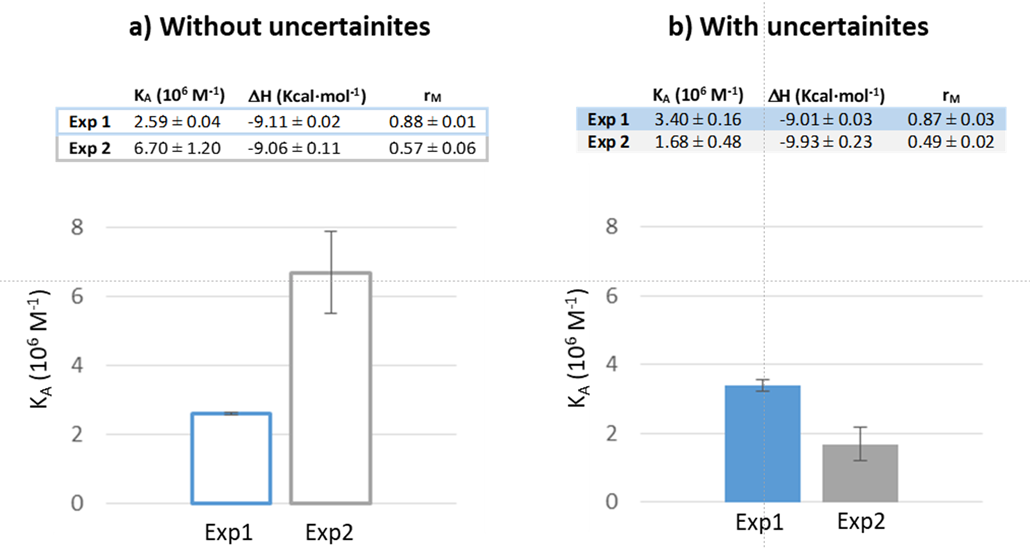
 

Figure 1. A)  Global fitting 2 where KΔH  and rA are global parameters and rM is individual between isotherms. B) Global fitting 1 where KAΔH and rM are global parameters and rA is individual between isotherms.
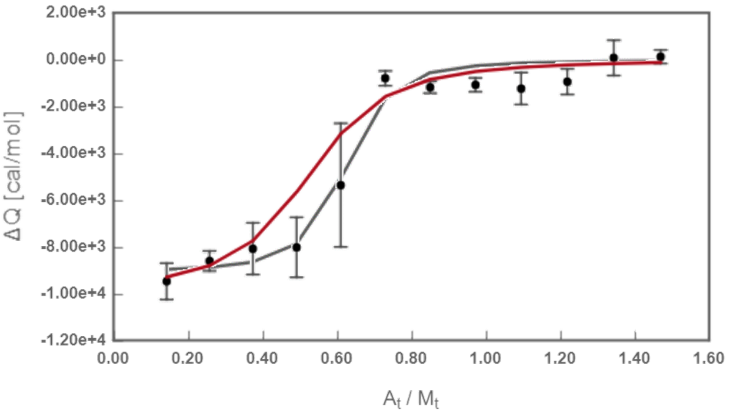
 

global fitting of the two isotherms was performed in which KAΔH  and rA are shared fitting parameters amongst the isotherms; moreover, rM* is set as individual fitting parameter to check for potential deviations between nominal and true concentration of M in replicate 1; similarly, a global fitting was performed in which KAΔH and rM are shared parameters, and rA* is an individual fitting parameter to check for potential deviations between nominal and true concentration of (figure 1).

Figure 2. Representation of the experiment using the AFFINImeter AM code.


Comparison of the two global fittings clearly shows that a good result is only achieved when deviations in the concentration of A is considered. The value of rA obtained indicates that the active concentration of A is 79% times the nominal concentration (table).

Table: Results obtained from global fitting 2.


This protocol using AFFINImeter has already been proven to be useful in drug discovery programs, working with ligand samples of inaccurate concentration.

We would like to thank Dr. Eric Ennifar (University of Strasbourg) for kindly providing the ITC experiments described herein.


*rM, rA, are scaling parameters employed to correct for potential differences between the nominal and true concentration of compounds M and A, respectively.

AFFINImeter new version!

During the last months, we’ve contacted you asking your opinion and experience with the software. Thanks for all your suggestions and needs we have improved the previous version of the software to make it easier, faster and more versatile.

What is new in this release?

  • In collaboration with Mestrelab Software, AFFINImeter can now analyze Nuclear Magnetic Resonance (NMR)  titration curves.

  • The Main toolbar has been simplified:

Data” & “Projects” have been merged into a single “Projects & Data*” menu

You can filter the elements to show by selecting “Projects & Data” (default), only “Projects” or only “Data“.

A new option has been included to easily pre-visualize the settings of your experiments directly from the list of data & projects.

The “Instruments” management menu has been removed.

*Data elements are represented by this icon –>  
*Projects elements are represented by this icon–> 


  • Now you can organize all your data and projects into folders:


  • Organize your data & projects as you would do on your computer.
  • Looking for your already existing KinITC data? Go to Projects & Data, and look into the folder “KINITC”.
  • A new parameter has been introduced to measure the quality of the FIT: Goodness of Fit

The GoF (Goodness of Fit) is the probability of finding the fitted value within a normal distribution with half-width equal to the uncertainty of each experimental point. The GoF for a curve is obtained as the mean GoF of all its points. The ideal value of perfect fit would be Gof=100%.

This parameter will be available when you execute a new FIT project/or re-execute an older project. If you visualize an already executed project, the previous parameter (χ 2) still will be present.

What have we improved from the previous version?

  • We have incorporated the possibility to perform blank subtraction right after raw data upload and processing.
  • Multiple minor usability improvements and performance tweaks.
  • Multiple bug fixes and issues suggested by our users have been implemented and resolved.


Try the new AFFINImeter here