The relevance of uncertainties.
The reliable determination of binding constants (Ka) and enthalpies (ΔH) from Isothermal Titration Calorimetry depends, among other aspects, on the quality of the thermogram recorded where a high signal-to-noise ratio is pursued to get a trusty isotherm. Low signal-to-noise ratio conducts to less precise integration of the thermogram peaks and, consequently, to a binding isotherm defined by points with larger related uncertainties. Logically, the uncertainty associated to the integral points will significantly affect the determination of the thermodynamic parameters and should not be set aside through the data analysis.
Here´s an illustrative example of two ITC experiments of the interaction between Carbonic Anhydrase II (CA) and 4-carboxybenzenesulfonamide (4-CBS) that yielded thermograms of different quality (Fig 1*).
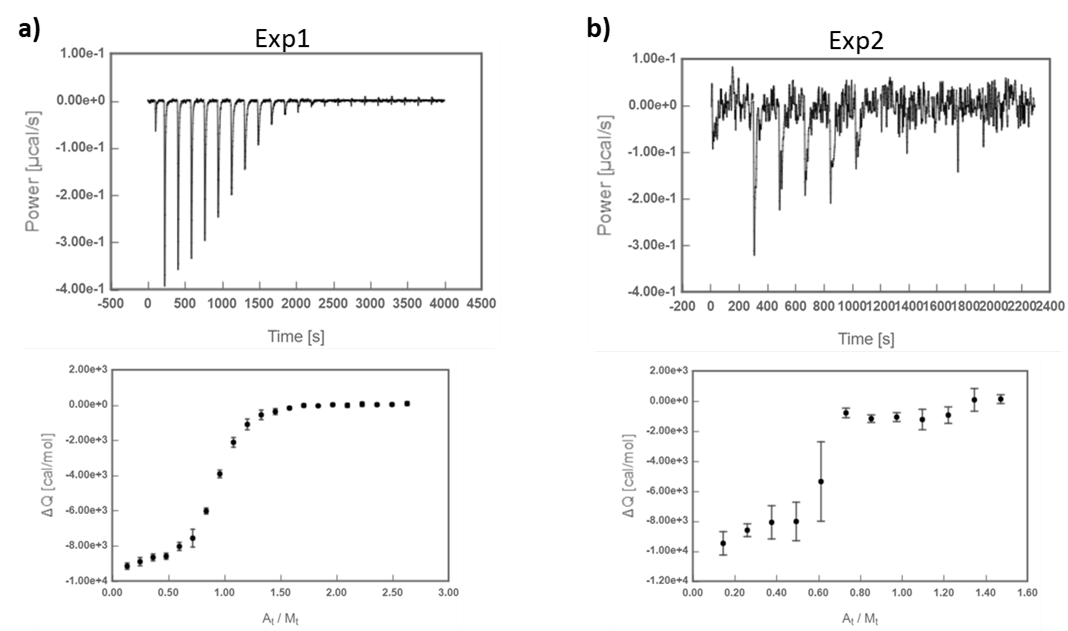
Fig.1 ITC titrations of 4-CBS into CA. a) Exp1, higher signal-to-noise ratio; b) Exp2, lower signal-to-noise ratio.
The results show a larger discrepancy in the Ka values obtained from Exp2, depending on whether or not the uncertainties are included in the fitting. Besides, the Ka obtained from the weighted fitting of Exp2 is significantly closer to the corresponding Ka value of the weighted fitting of Exp1 (Figure 2).
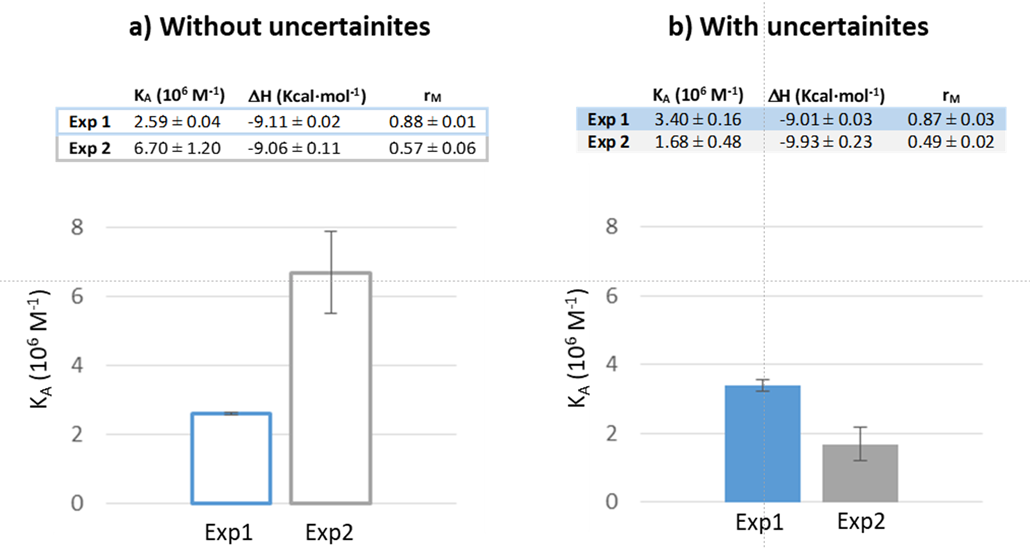
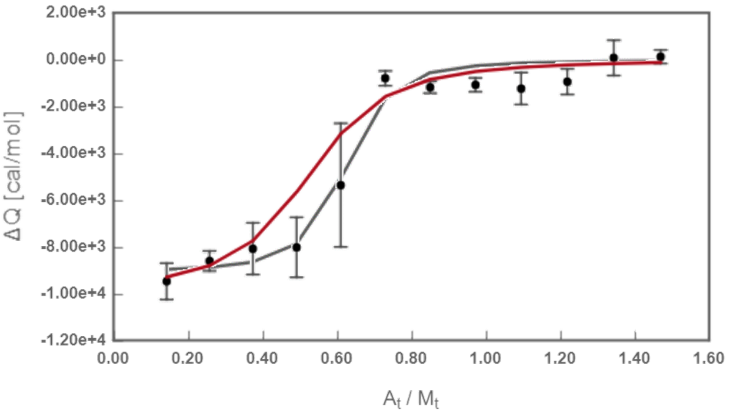 Fig.3 Fitted isotherm from Exp 2. Redline: theoretical curve calculated when considering uncertainties; black line: theoretical curve calculated with no uncertainties.