As important as obtaining a set of parameters corresponding to a model able to describe the experimental data is to ensure, with a certain statistical probability, that the analysis is correct. Often, this is a complicated task. AFFINImeter´s philosophy is to make things simple. We have developed a number of mathematical and statistical tools that are useful to assess how robust your analysis is.
The next paragraphs will explain the meaning of some parameters implemented in AFFINImeter and how to interpret them in terms of the quality of the analysis.
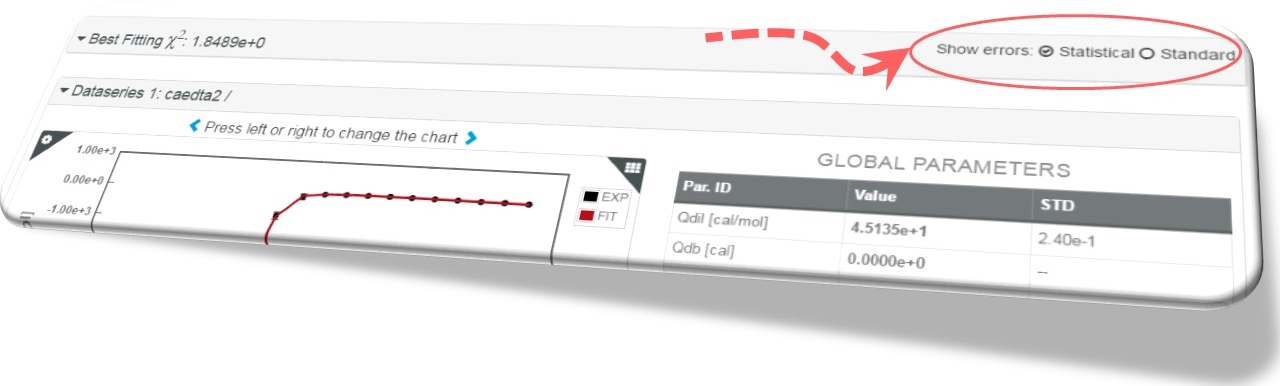
What is the meaning of Standard errors in AFFINImeter?
Standard errors come from the variance-covariance matrix obtained from the partial derivatives of the objective function with respect to the fitting parameters. These are the errors commonly determined in nonlinear fitting algorithms based on derivatives, such as the Levenberg-Marquardt method that we employ in combination with the Simulated Annealing method to optimize the efficiency of the minimization process.
What is the meaning of Statistical errors in AFFINImeter?
Statistical errors are determined from the standard deviation of the parameters obtained by repeating the fitting as many times as experimental points are available in the target data series, each time ignoring one point in these extra fittings. For instance, in a binding isotherm consisting of 30 points, all of them are employed in the main minimization process (weighted by their corresponding uncertainty). The resulting parameters are used as seeds for 30 independent fittings (of 29 points each) where the data points are sequentially removed one at a time. In this case, AFFINImeter gets 30 independent solutions for each parameter (in addition to the one provided by the main fitting). The removal of the points that weight a lot in the fittings induces a significant change in the parameters that, in its turn, increases the standard deviation (the statistical error in AFFINImeter). This is the so-called Jackknife method.
By default, the statistical uncertainties are activated in AFFINImeter but we do provide also the standard errors in order to have a useful alternative value for the uncertainty of the fitting parameters.
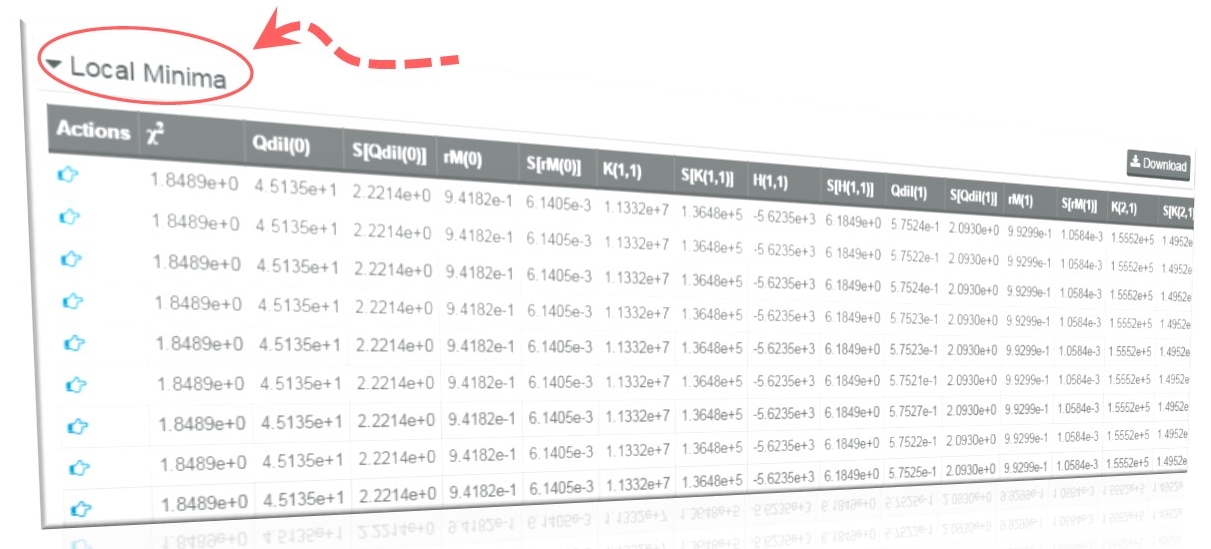
What is the meaning of Local Minima table in AFFINImeter?
Additional useful information to be considered in the resulting analysis with AFFINImeter is the local minima table. This table provides an estimation on how the results obtained depend on the initial values (seeds) of the fitting algorithm. AFFINImeter executes several minimizations runs (20 by default) for each analysis and it selects the values that provide the best fitting (lowest c2 value). A robust fitting is achieved when the same results are reached independently of the random initial seeds. If the local minima table shows different results for the different runs of the algorithm with similar c2 values, the analysis is probably overparameterized. In that case, it will necessary to simplify the model, thus reducing the number of fitting variables, or to include additional data series for a global fitting, thus reducing the number of degrees of freedom in the analysis.