Fluorescence Polarization competition assays are widely used in numerous research fields to determine the affinity of unlabeled ligands that compete with a fluorescent probe for binding with the same macromolecule. Herein, we show how to perform a thoughtful analysis of these experiments with AFFINImeter for spectroscopic techniques, to elucidate, not just IC50 values, but also a quantitative direct measurement (KA) of the binding affinity.
Introduction
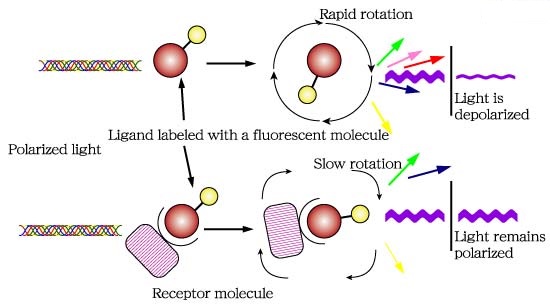
Fluorescence polarization (FP) is a powerful technique that nowadays is widely utilized in high-throughput screening (HTS) and drug discovery (1). In FP assays monitoring a binding event is possible mainly because this technique is sensitive to changes in molecular weight. The assay requires of a fluorescent molecule (the probe) that is excited by plane-polarized light. For small molecules, the initial polarization decreases rapidly due to rotational diffusion during the lifetime of the fluorescence, which results in low fluorescence polarization. When the small fluorescent molecule binds to a larger molecule (and consequently of slower rotation) an increased fluorescent polarization is observed (Fig. 1).
Advances in experimental aspects of the technique like assay design and fluorescent probes is enabling the application of FP to increasingly complex biological processes (1).
Fig.1. The principle of fluorescence polarization (2).
Frequently, a competition displacement assay format is used in FP experiments where a fluorescent labelled molecule bound to a macromolecule is displaced by an unlabeled molecule with the consequent decrease of polarization. This assay yields a quantitative measure of IC50 values (half maximal inhibitory concentration) of the unlabeled competitors. However, IC50 does not provide a direct measure of affinity and the calculation of the binding constant (KA) is often desirable. In this sense, the software AFFINImeter Spectroscopy offers exclusive analysis tools to perform a thoughtful analysis of FP competition assays, to directly deliver values of binding constants of the interaction between the competitor and the macromolecule. As an illustrative example, we present herein the use of AFFINImeter Spectroscopy for the analysis of FP competition assays to characterize oligosaccharide –protein interactions.
FP competition assays to study the binding between midkine and chondroitin sulfate-like tetrasaccharides
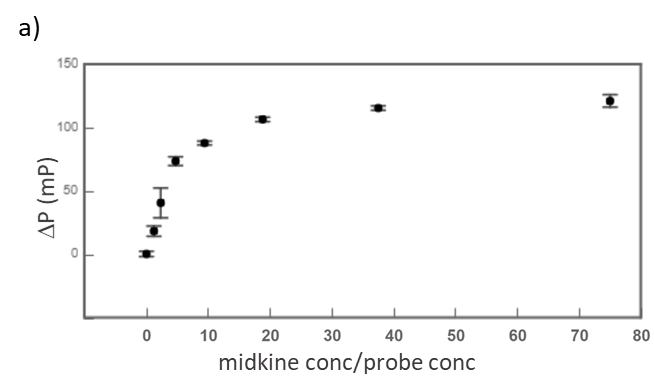
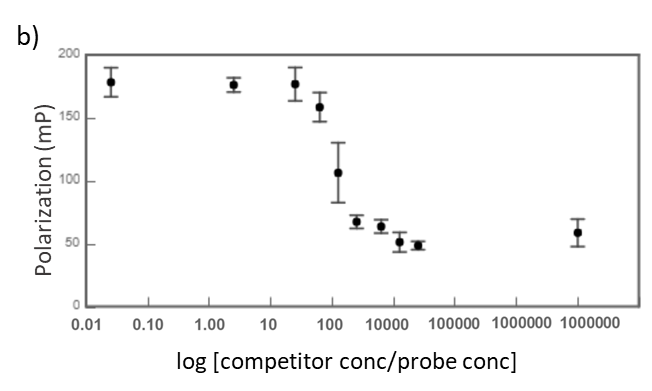
Midkine is a cytokine which biological activity is regulated by its binding with glycosaminoglycans (GAGs), such as heparin and chondroitin sulfate. To better understand these recognition processes Pedro M. Nieto et al. have recently reported the binding of a series of synthetic chondroitin sulfate-like tetrasaccharides with midkine, using FP competition assays (3). First, the direct binding of midkine and a fluorescein labelled heparin hexasaccharide (fluorescent probe) was monitored in a direct FP titration (Fig. 2a). Second, FP competition assays were performed, in which the polarization of samples containing fixed concentrations of midkine and fluorescent probe was recorded in the presence of increasing concentrations of different synthetic sugars to obtain the corresponding IC50 values (Fig. 2b) (3).
Fig.2. a) Binding curve of the titration of fluorescent probe with midkine 3a;b) Representative competition curve (semi-log plot) of an FP competition assay where the fluorescent probe is displaced from a pre-formed complex with midkine by the competitor.
Analysis of FP competition assays with AFFINImeter Spectroscopy
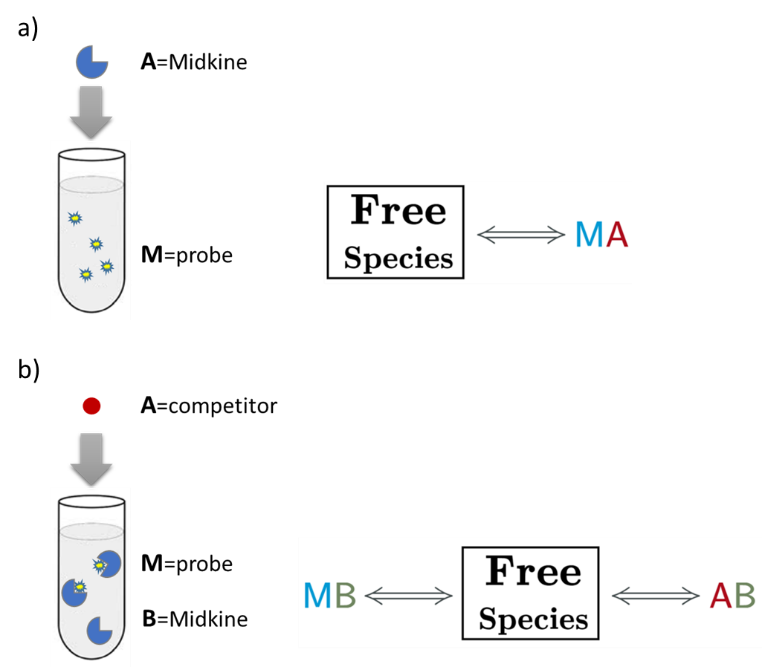
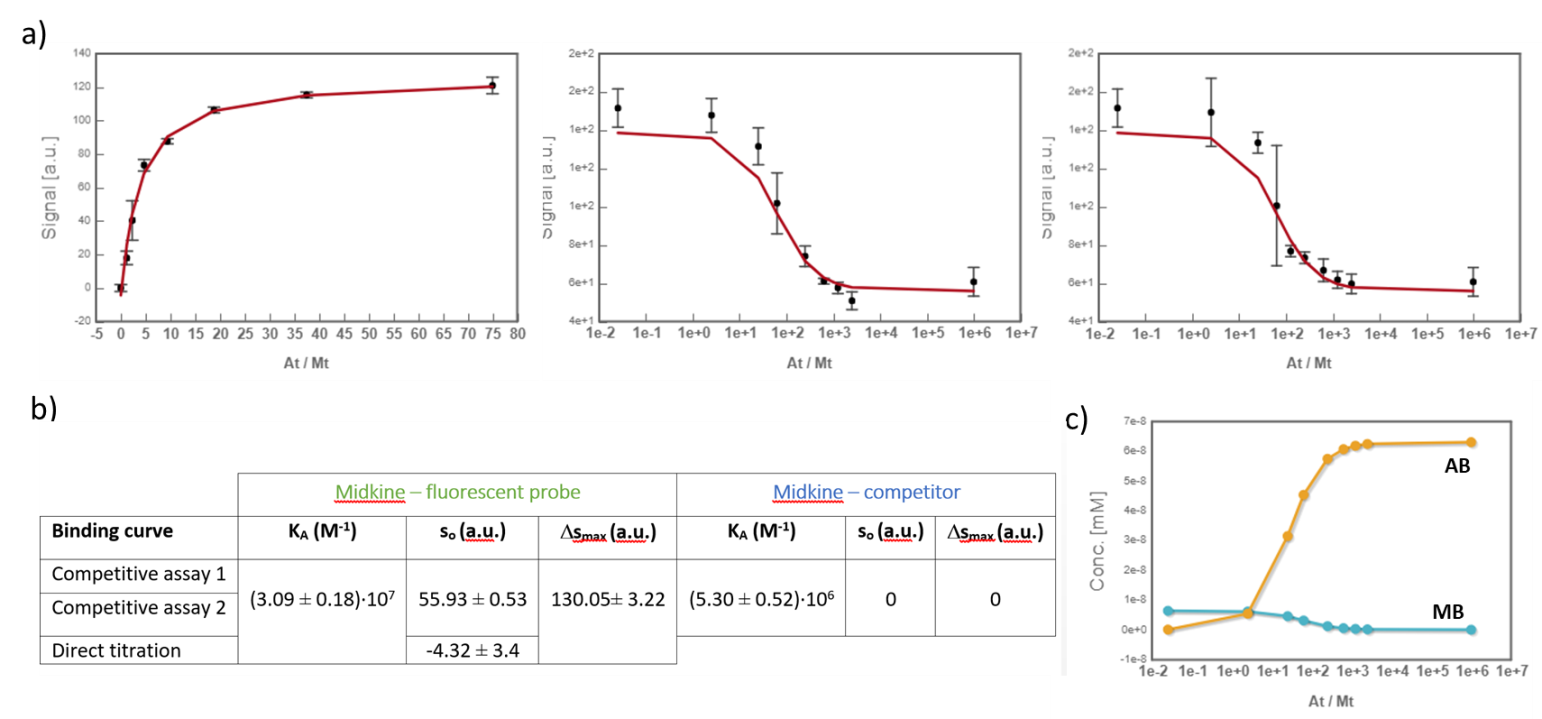
The determination of KA of the interaction of the unlabeled ligand with the macromolecule in an FP competition assay is possible if the corresponding curve is analyzed using a competitive binding model where two equilibria are described, one between the free species and the macromolecule–probe complex and one between the free species and the macromolecule–competitor complex. In this analysis, the KA value of the interaction between probe and macromolecule can be fixed (as it can be previously calculated from the direct binding experiment) in order to determine KA of the competitor-macromolecule complex. Yet, a more robust approach consists of a global analysis of direct and competitive curves where constraints between experimental parameters are imposed. Using this approach, we have used AFFINImeter Spectroscopy in the analysis of data from the direct measurement of the fluorescent labelled hexasaccharide binding to midkine and together with data from the displacement assay using an unlabeled, synthetic disaccharide as a competitor (4).
An AFFINImeter fitting project was generated where the curve from the direct titration and two curves from replicates of the competitive assay were included. A 1:1 simple binding model and a competitive model were used to fit direct and competitive data, respectively (Fig. 3).
Fig.3. Schematic representation of the binding models used to fit the FP data.5 These models can be easily built with the “model builder” tool of AFFINImeter where a) in the 1:1 model “M” represents the species sensitive to binding (fluorescent probe) and “A” represents the titrant (midkine); b) in the competitive model “M” is the sensitive species (probe), A is the titrant (competitor) and B is a third species involved in the event (midkine in a preformed complex with the probe).
In the analysis, the fitting parameters considered were the KA of each complex, the signal value of the unbound state (s0), and the maximum signal change (Δsmax) of the midkine-probe complex formation. Δsmax of the midkine-competitor complex is equal to zero because the competitor is not fluorescent. Since midkine-probe binding is present in both models, restrictions were made considering that KA and Δsmax of the 1:1 model (FS↔MA) are equal to the same parameters describing this equilibrium in the competitive model (FS↔MB). Besides, s0 was common between replicates of the competitive assay. It is worth to mention that the curves analyzed are the mean of three replicate experiments and the corresponding standard deviation of the curve data points are also considered in the fitting process. The global analysis performed in this way returned the KA of the interaction of midkine with the probe, (3.09 ± 0.18)*107 M-1, and with the competitor, (5.30 ± 0.52)*106 M-1 (Fig. 4). Additionally, AFFINImeter automatically generates the species distribution plot, valuable in the interpretation of results. The species distribution plot of Fig. 4c shows the displacement of the probe by the unlabeled disaccharide in the competition assay.
Fig.4. a) Global analysis of FP curves from the direct titration of probe (10 nM) with midkine (12 – 750 nM) and from a competitive assay consisting of a sample with probe (10 nM) and midkine (63 nM) where the competitor is added at increasing concentrations (0 – 20 mM). Curves from two replicates of the competitive assay were used in the analysis. All the polarization values are the average of three replicate wells and the error bars represent the corresponding standard deviation; b) values of KA, s0 and Δsmax determined for each equilibrium; c) species distribution semi-log plot of the competitive assay.
Conclusions
This case study exemplifies the utility of AFFINImeter Spectroscopy in the analysis of FP competitive binding assays. The advantages of using this software rely on the possibility to obtain reliable KA values of the binding between competitor and macromolecule from a global analysis where KA and Δsmax of the probe-macromolecule complex, are shared parameters between curves (they are not pre-determined fixed parameters). Besides, standard deviation between replicates is taken into account in the fitting process. Ultimately, these tools provide a more robust analysis and reliable characterization of binding interactions monitored through competitive assays.
Acknowledgements
We would like to thank Dr Pedro Nieto Mesa and Dr José Luis de Paz Carrera from the Institute of Chemical Research (IIQ) of the Spanish National Research Council (CSIC), for kindly share with us the FP data presented herein.
References & Notes
1 Hall, M.; Yasgar, A.; Peryea, T.; Braisted, J.; Jadhav, A.; Simeonov, A.; Coussens, N. Fluorescence Polarization Assays In High-Throughput Screening And Drug Discovery: A Review. Methods and Applications in Fluorescence 2016, 4, 022001.
2 This figure has been taken from http://glycoforum.gr.jp/science/word/glycotechnology/GT-C06E.html.
3 a) Solera, C.; Macchione, G.; Maza, S.; Kayser, M.; Corzana, F.; de Paz, J.; Nieto, P. Chondroitin Sulfate Tetrasaccharides: Synthesis, Three-Dimensional Structure And Interaction With Midkine. Chemistry – A European Journal 2016, 22, 2356-2369; b) Maza, S.; Gandia-Aguado, N.; de Paz, J.; Nieto, P. Fluorous-Tag Assisted Synthesis Of A Glycosaminoglycan Mimetic Tetrasaccharide As A High-Affinity FGF-2 And Midkine Ligand. Bioorganic & Medicinal Chemistry 2018, 26, 1076-1085.
4 The competitor is a synthetic disulfated disaccharide described in ref. 3b as compound 18.
5 These model were created with the “model builder” tool, exclusive of AFFINImeter. For more information go to AFFINImeter knowledge center.
